Key Stats
How many TL/TLX did Acura sell in 2022?
Acura sold 139 TL/TLX in 2022. (From Jan - Feb 2022)
How many TL/TLX did Acura sell in February 2022?
Acura sold 63 TL/TLX in February 2022.
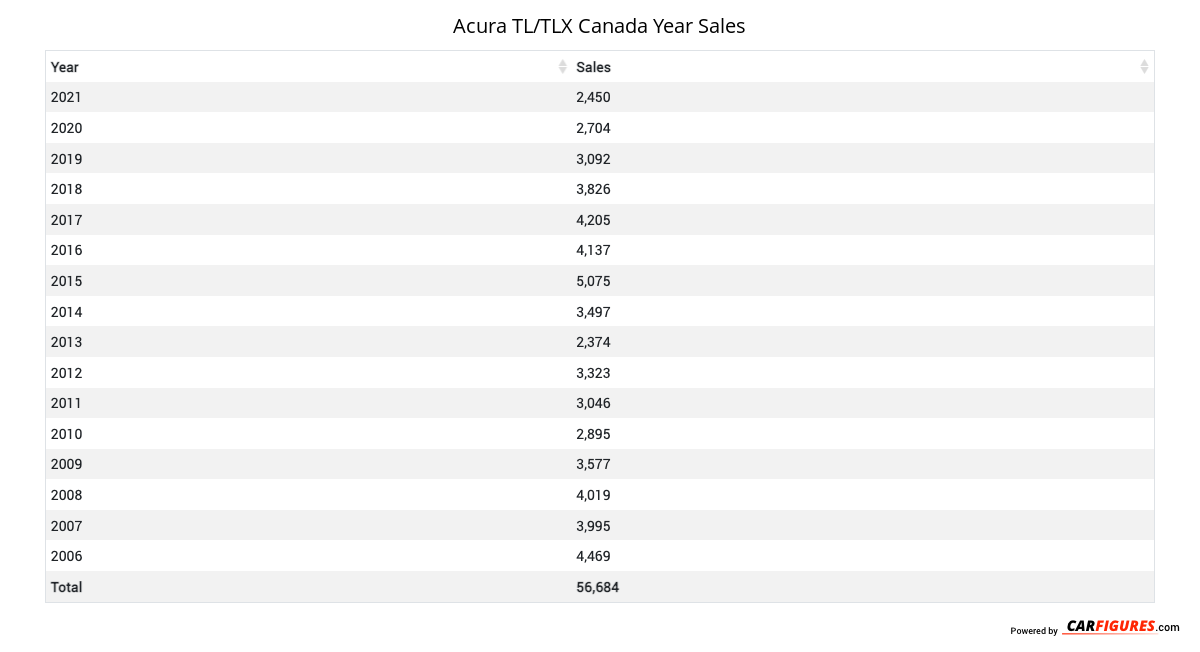
How many TL/TLX did Acura sell in 2021?
Acura sold 2,450 TL/TLX in 2021. In 2020, Acura sold 2,704 TL/TLX. They sold 254 more units in year 2020 compared to 2021 with a percent loss of 9.39% YoY.
Overview
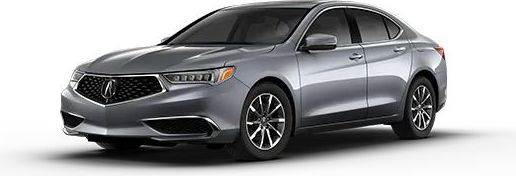
The 2014 Acura TL seats up to 5 people and has a starting weight of 1695 kg.
How Much Does the 2014 Acura TL Cost?
Pricing for the 2014 Acura TL starts at $39,990 MSRP and goes up to $49,590 fully loaded.
Acura TL Engine, Transmission, and Performance Numbers
The Acura TL delivers 280 horsepower and 254 ft-lb torque with a front-wheel-drive drivetrain.
List of Acura TL Competitors
Some of Acura TL competitors include the Buick LaCrosse, Toyota Avalon, Infiniti Q50, Lincoln MKZ and Nissan Maxima.
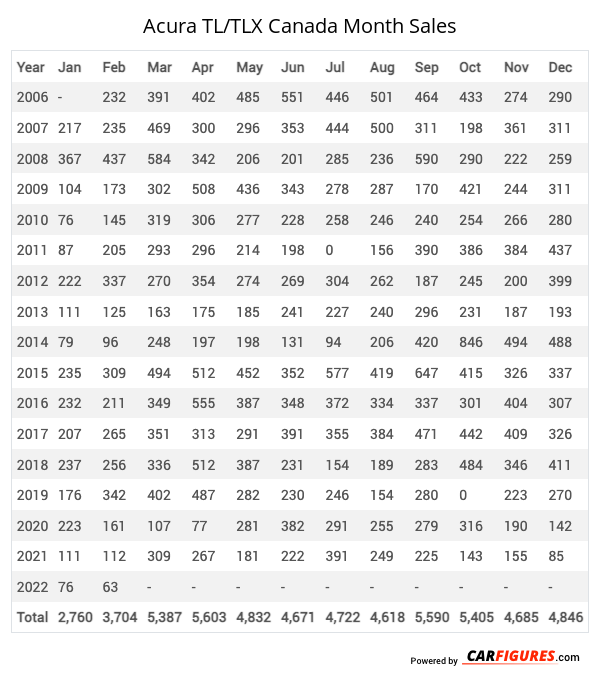
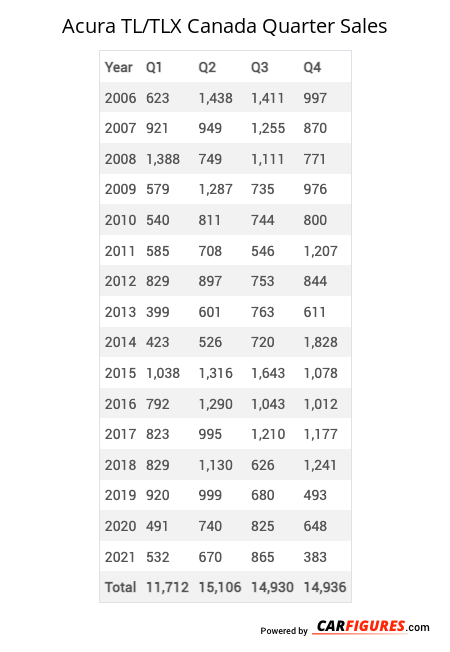
Acura TL/TLX Canadian Sale figures by year, quarter, and month are presented below. Including the most up to date sales data for the Acura TL/TLX.
| Year | Jan | Feb | Mar | Apr | May | Jun | Jul | Aug | Sep | Oct | Nov | Dec |
|---|---|---|---|---|---|---|---|---|---|---|---|---|
| 2006 | - | 232 | 391 | 402 | 485 | 551 | 446 | 501 | 464 | 433 | 274 | 290 |
| 2007 | 217 | 235 | 469 | 300 | 296 | 353 | 444 | 500 | 311 | 198 | 361 | 311 |
| 2008 | 367 | 437 | 584 | 342 | 206 | 201 | 285 | 236 | 590 | 290 | 222 | 259 |
| 2009 | 104 | 173 | 302 | 508 | 436 | 343 | 278 | 287 | 170 | 421 | 244 | 311 |
| 2010 | 76 | 145 | 319 | 306 | 277 | 228 | 258 | 246 | 240 | 254 | 266 | 280 |
| 2011 | 87 | 205 | 293 | 296 | 214 | 198 | 0 | 156 | 390 | 386 | 384 | 437 |
| 2012 | 222 | 337 | 270 | 354 | 274 | 269 | 304 | 262 | 187 | 245 | 200 | 399 |
| 2013 | 111 | 125 | 163 | 175 | 185 | 241 | 227 | 240 | 296 | 231 | 187 | 193 |
| 2014 | 79 | 96 | 248 | 197 | 198 | 131 | 94 | 206 | 420 | 846 | 494 | 488 |
| 2015 | 235 | 309 | 494 | 512 | 452 | 352 | 577 | 419 | 647 | 415 | 326 | 337 |
| 2016 | 232 | 211 | 349 | 555 | 387 | 348 | 372 | 334 | 337 | 301 | 404 | 307 |
| 2017 | 207 | 265 | 351 | 313 | 291 | 391 | 355 | 384 | 471 | 442 | 409 | 326 |
| 2018 | 237 | 256 | 336 | 512 | 387 | 231 | 154 | 189 | 283 | 484 | 346 | 411 |
| 2019 | 176 | 342 | 402 | 487 | 282 | 230 | 246 | 154 | 280 | 0 | 223 | 270 |
| 2020 | 223 | 161 | 107 | 77 | 281 | 382 | 291 | 255 | 279 | 316 | 190 | 142 |
| 2021 | 111 | 112 | 309 | 267 | 181 | 222 | 391 | 249 | 225 | 143 | 155 | 85 |
| 2022 | 76 | 63 | - | - | - | - | - | - | - | - | - | - |
| Total | 2760 | 3704 | 5387 | 5603 | 4832 | 4671 | 4722 | 4618 | 5590 | 5405 | 4685 | 4846 |
| Year | Q1 | Q2 | Q3 | Q4 |
|---|---|---|---|---|
| 2006 | 623 | 1438 | 1411 | 997 |
| 2007 | 921 | 949 | 1255 | 870 |
| 2008 | 1388 | 749 | 1111 | 771 |
| 2009 | 579 | 1287 | 735 | 976 |
| 2010 | 540 | 811 | 744 | 800 |
| 2011 | 585 | 708 | 546 | 1207 |
| 2012 | 829 | 897 | 753 | 844 |
| 2013 | 399 | 601 | 763 | 611 |
| 2014 | 423 | 526 | 720 | 1828 |
| 2015 | 1038 | 1316 | 1643 | 1078 |
| 2016 | 792 | 1290 | 1043 | 1012 |
| 2017 | 823 | 995 | 1210 | 1177 |
| 2018 | 829 | 1130 | 626 | 1241 |
| 2019 | 920 | 999 | 680 | 493 |
| 2020 | 491 | 740 | 825 | 648 |
| 2021 | 532 | 670 | 865 | 383 |
| Total | 11712 | 15106 | 14930 | 14936 |
| Year | Sales |
|---|---|
| 2021 | 2450 |
| 2020 | 2704 |
| 2019 | 3092 |
| 2018 | 3826 |
| 2017 | 4205 |
| 2016 | 4137 |
| 2015 | 5075 |
| 2014 | 3497 |
| 2013 | 2374 |
| 2012 | 3323 |
| 2011 | 3046 |
| 2010 | 2895 |
| 2009 | 3577 |
| 2008 | 4019 |
| 2007 | 3995 |
| 2006 | 4469 |
| Total | 56684 |
Download Historic Sales Data
Looking for more data/visualizations? Send us an email at [email protected] for customized data aggregates and visualizations.Embedded Code
See more widgetsSources: Manufacturers

