Key Stats
How many E/CLS did Mercedes-Benz sell in Q4 2019?
Mercedes-Benz sold 519 E/CLS in Q4 2019.
How many E/CLS did Mercedes-Benz sell in 2021?
Mercedes-Benz sold 1,828 E/CLS in 2021. In 2020, Mercedes-Benz sold 1,798 E/CLS. They sold 30 more units in 2021 compared to 2020 with a percent gain of 1.67% YoY.
Overview
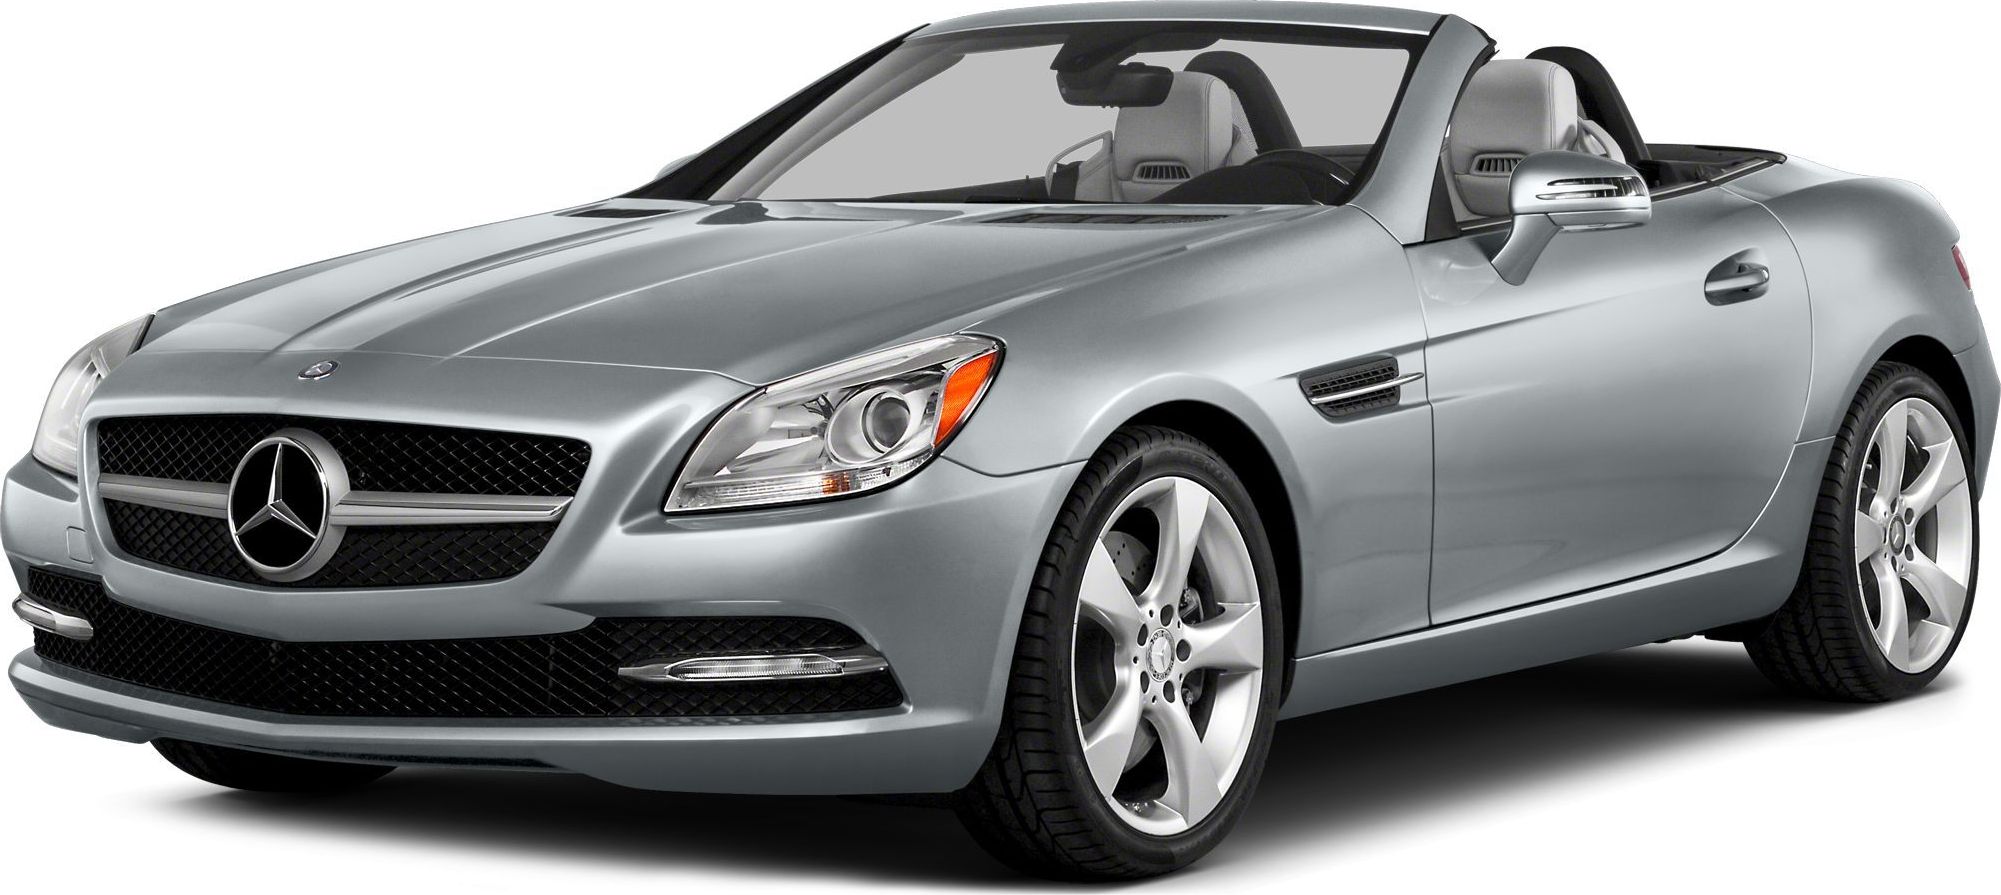
The 2022 Mercedes-Benz E-Class is a vehicle from automaker Mercedes-Benz.
How Much Does the 2022 Mercedes-Benz E-Class Cost?
The 2022 Mercedes-Benz E-Class starts at $65,700 MSRP. Fully loaded, the Mercedes-Benz E-Class will cost you about $100,700.
Mercedes-Benz E-Class Engine, Transmission, and Performance Numbers
Mercedes-Benz E-Class is powered by a all-wheel-drive powertrain that makes 255 horsepower and 273 ft-lb torque.
List of Mercedes-Benz E-Class Competitors
Some of Mercedes-Benz E-Class competitors include the BMW 5-Series, Genesis G80, Lexus ES, BMW 5-Series, BMW 5-Series, Genesis G80, BMW 5-Series, BMW 5-Series, Lexus GS and Lexus ES.
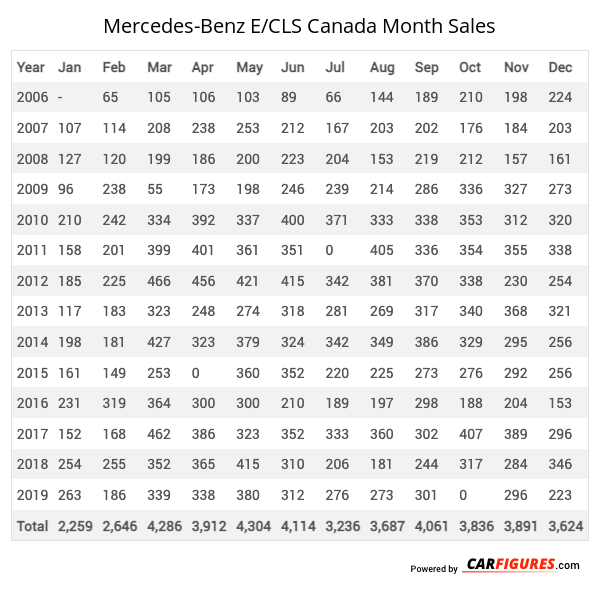
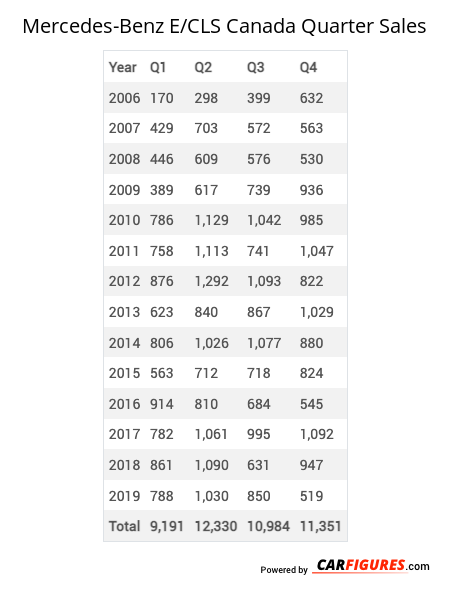
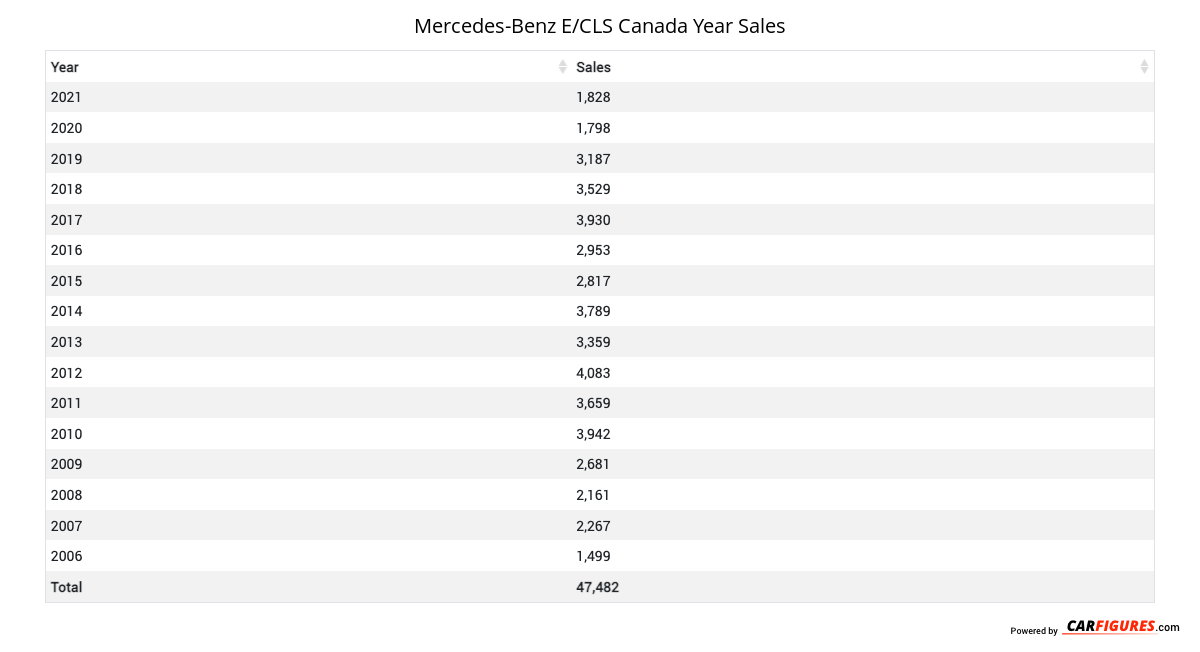
Mercedes-Benz E/CLS Canadian Sale figures by year, quarter, and month are presented below. Including the most up to date sales data for the Mercedes-Benz E/CLS.
| Year | Jan | Feb | Mar | Apr | May | Jun | Jul | Aug | Sep | Oct | Nov | Dec |
|---|---|---|---|---|---|---|---|---|---|---|---|---|
| 2006 | - | 65 | 105 | 106 | 103 | 89 | 66 | 144 | 189 | 210 | 198 | 224 |
| 2007 | 107 | 114 | 208 | 238 | 253 | 212 | 167 | 203 | 202 | 176 | 184 | 203 |
| 2008 | 127 | 120 | 199 | 186 | 200 | 223 | 204 | 153 | 219 | 212 | 157 | 161 |
| 2009 | 96 | 238 | 55 | 173 | 198 | 246 | 239 | 214 | 286 | 336 | 327 | 273 |
| 2010 | 210 | 242 | 334 | 392 | 337 | 400 | 371 | 333 | 338 | 353 | 312 | 320 |
| 2011 | 158 | 201 | 399 | 401 | 361 | 351 | 0 | 405 | 336 | 354 | 355 | 338 |
| 2012 | 185 | 225 | 466 | 456 | 421 | 415 | 342 | 381 | 370 | 338 | 230 | 254 |
| 2013 | 117 | 183 | 323 | 248 | 274 | 318 | 281 | 269 | 317 | 340 | 368 | 321 |
| 2014 | 198 | 181 | 427 | 323 | 379 | 324 | 342 | 349 | 386 | 329 | 295 | 256 |
| 2015 | 161 | 149 | 253 | 0 | 360 | 352 | 220 | 225 | 273 | 276 | 292 | 256 |
| 2016 | 231 | 319 | 364 | 300 | 300 | 210 | 189 | 197 | 298 | 188 | 204 | 153 |
| 2017 | 152 | 168 | 462 | 386 | 323 | 352 | 333 | 360 | 302 | 407 | 389 | 296 |
| 2018 | 254 | 255 | 352 | 365 | 415 | 310 | 206 | 181 | 244 | 317 | 284 | 346 |
| 2019 | 263 | 186 | 339 | 338 | 380 | 312 | 276 | 273 | 301 | 0 | 296 | 223 |
| Total | 2259 | 2646 | 4286 | 3912 | 4304 | 4114 | 3236 | 3687 | 4061 | 3836 | 3891 | 3624 |
| Year | Q1 | Q2 | Q3 | Q4 |
|---|---|---|---|---|
| 2006 | 170 | 298 | 399 | 632 |
| 2007 | 429 | 703 | 572 | 563 |
| 2008 | 446 | 609 | 576 | 530 |
| 2009 | 389 | 617 | 739 | 936 |
| 2010 | 786 | 1129 | 1042 | 985 |
| 2011 | 758 | 1113 | 741 | 1047 |
| 2012 | 876 | 1292 | 1093 | 822 |
| 2013 | 623 | 840 | 867 | 1029 |
| 2014 | 806 | 1026 | 1077 | 880 |
| 2015 | 563 | 712 | 718 | 824 |
| 2016 | 914 | 810 | 684 | 545 |
| 2017 | 782 | 1061 | 995 | 1092 |
| 2018 | 861 | 1090 | 631 | 947 |
| 2019 | 788 | 1030 | 850 | 519 |
| Total | 9191 | 12330 | 10984 | 11351 |
| Year | Sales |
|---|---|
| 2021 | 1828 |
| 2020 | 1798 |
| 2019 | 3187 |
| 2018 | 3529 |
| 2017 | 3930 |
| 2016 | 2953 |
| 2015 | 2817 |
| 2014 | 3789 |
| 2013 | 3359 |
| 2012 | 4083 |
| 2011 | 3659 |
| 2010 | 3942 |
| 2009 | 2681 |
| 2008 | 2161 |
| 2007 | 2267 |
| 2006 | 1499 |
| Total | 47482 |
Download Historic Sales Data
Embedded Code
See more widgetsSources: Manufacturers