Key Stats
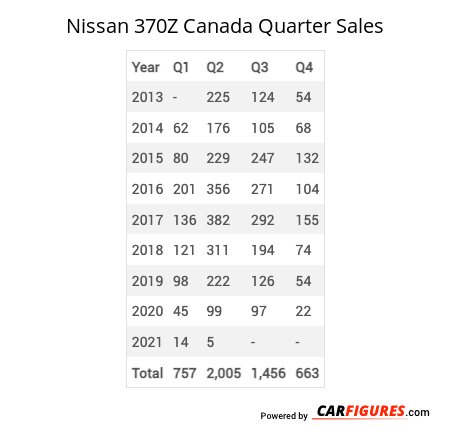
How many 370Z did Nissan sell in Q2 2021?
Nissan sold 5 370Z in Q2 2021.
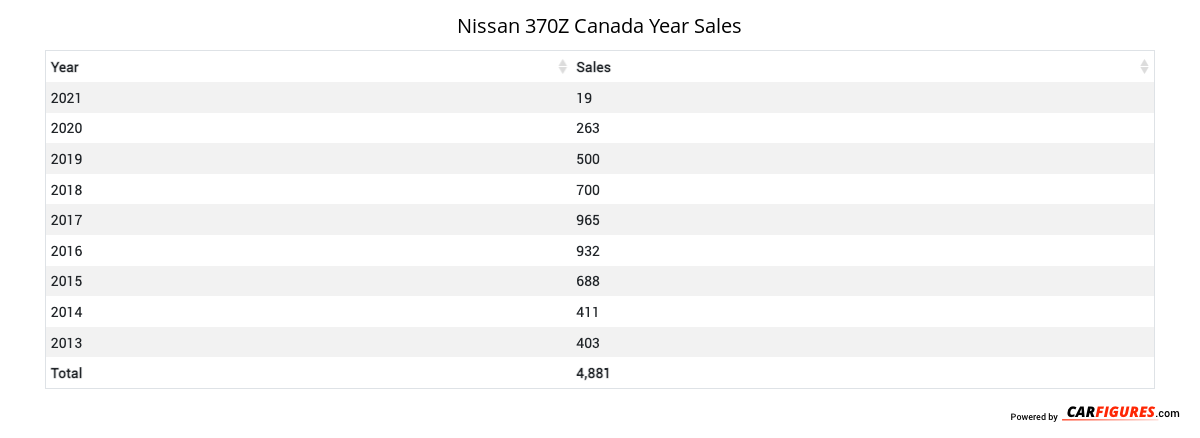
How many 370Z did Nissan sell in 2021?
Nissan sold 19 370Z in 2021. In 2020, Nissan sold 263 370Z. They sold 244 more units in year 2020 compared to 2021 with a percent loss of 92.78% YoY.
Overview
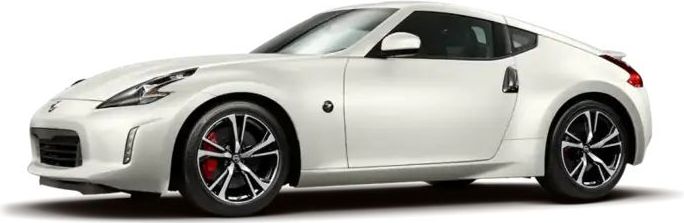
The 2020 Nissan 370Z is a vehicle from automaker Nissan.
How Much Does the 2020 Nissan 370Z Cost?
Pricing for the 2020 Nissan 370Z starts at $30,498 MSRP and goes up to $48,998 fully loaded.
Nissan 370Z Engine, Transmission, and Performance Numbers
The Nissan 370Z delivers 332 horsepower and 270 ft-lb torque with a rear-wheel-drive drivetrain.
List of Nissan 370Z Competitors
Some of Nissan 370Z competitors include the Toyota 86, Subaru BRZ, Toyota 86 and Subaru BRZ.
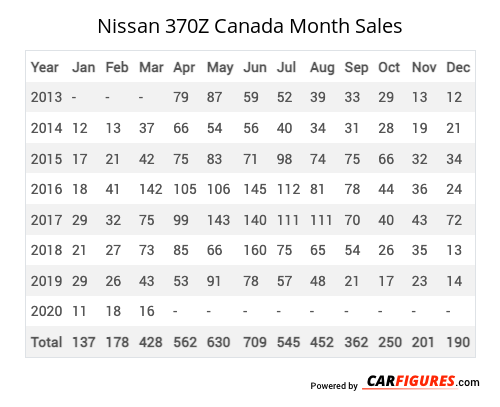
Nissan 370Z Canadian Sale figures by year, quarter, and month are presented below. Including the most up to date sales data for the Nissan 370Z. See how the Nissan 370Z stacks up the other models in the Cars, Sport/Performance Cars segments.
| Year | Jan | Feb | Mar | Apr | May | Jun | Jul | Aug | Sep | Oct | Nov | Dec |
|---|---|---|---|---|---|---|---|---|---|---|---|---|
| 2013 | - | - | - | 79 | 87 | 59 | 52 | 39 | 33 | 29 | 13 | 12 |
| 2014 | 12 | 13 | 37 | 66 | 54 | 56 | 40 | 34 | 31 | 28 | 19 | 21 |
| 2015 | 17 | 21 | 42 | 75 | 83 | 71 | 98 | 74 | 75 | 66 | 32 | 34 |
| 2016 | 18 | 41 | 142 | 105 | 106 | 145 | 112 | 81 | 78 | 44 | 36 | 24 |
| 2017 | 29 | 32 | 75 | 99 | 143 | 140 | 111 | 111 | 70 | 40 | 43 | 72 |
| 2018 | 21 | 27 | 73 | 85 | 66 | 160 | 75 | 65 | 54 | 26 | 35 | 13 |
| 2019 | 29 | 26 | 43 | 53 | 91 | 78 | 57 | 48 | 21 | 17 | 23 | 14 |
| 2020 | 11 | 18 | 16 | - | - | - | - | - | - | - | - | - |
| Total | 137 | 178 | 428 | 562 | 630 | 709 | 545 | 452 | 362 | 250 | 201 | 190 |
| Year | Q1 | Q2 | Q3 | Q4 |
|---|---|---|---|---|
| 2013 | - | 225 | 124 | 54 |
| 2014 | 62 | 176 | 105 | 68 |
| 2015 | 80 | 229 | 247 | 132 |
| 2016 | 201 | 356 | 271 | 104 |
| 2017 | 136 | 382 | 292 | 155 |
| 2018 | 121 | 311 | 194 | 74 |
| 2019 | 98 | 222 | 126 | 54 |
| 2020 | 45 | 99 | 97 | 22 |
| 2021 | 14 | 5 | - | - |
| Total | 757 | 2005 | 1456 | 663 |
| Year | Sales |
|---|---|
| 2021 | 19 |
| 2020 | 263 |
| 2019 | 500 |
| 2018 | 700 |
| 2017 | 965 |
| 2016 | 932 |
| 2015 | 688 |
| 2014 | 411 |
| 2013 | 403 |
| Total | 4881 |
Download Historic Sales Data
Embedded Code
See more widgetsSources: Manufacturers