Key Stats
How many CS35 did Changan sell in 2020?
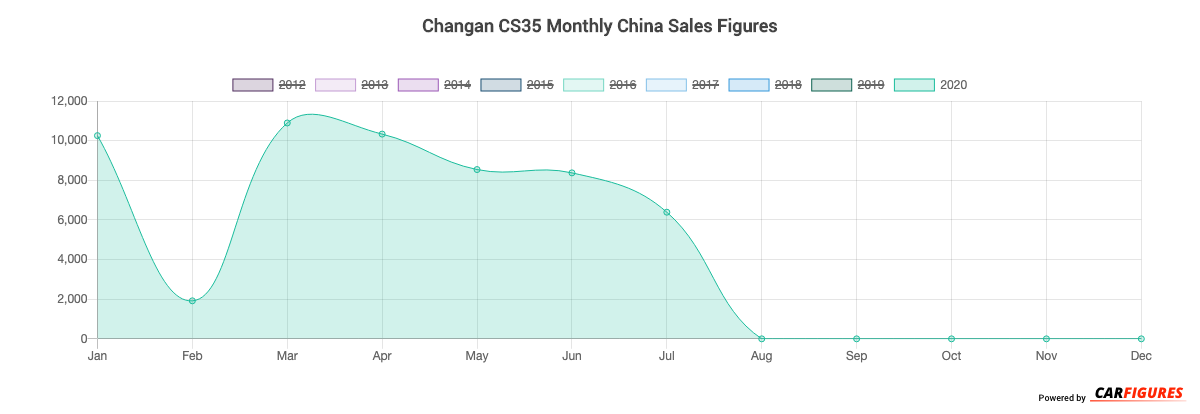
Changan sold 56,696 CS35 in 2020. (From Jan - Dec 2020)
How many CS35 did Changan sell in July 2020?
Changan sold 6,389 CS35 in July 2020.
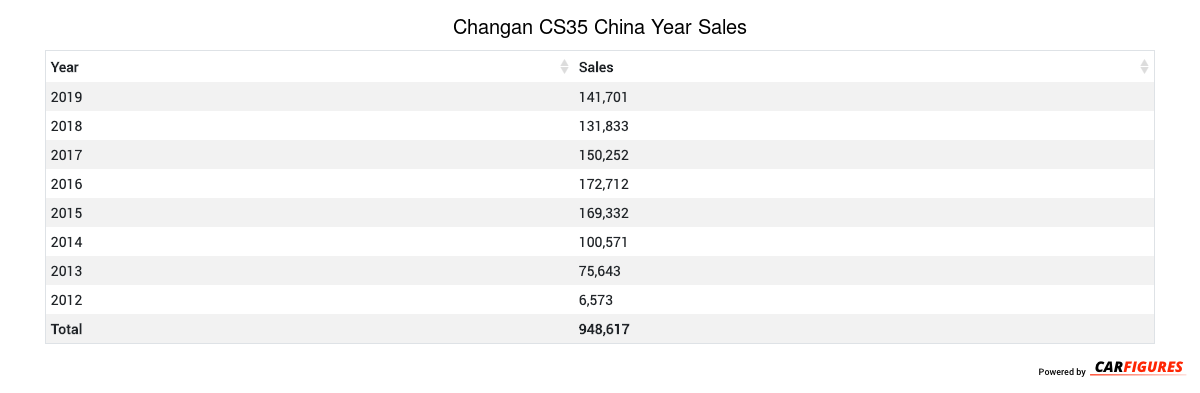
How many CS35 did Changan sell in 2019?
Changan sold 141,701 CS35 in 2019. In 2018, Changan sold 131,833 CS35. They sold 9,868 more units in 2019 compared to 2018 with a percent gain of 7.49% YoY.
Overview
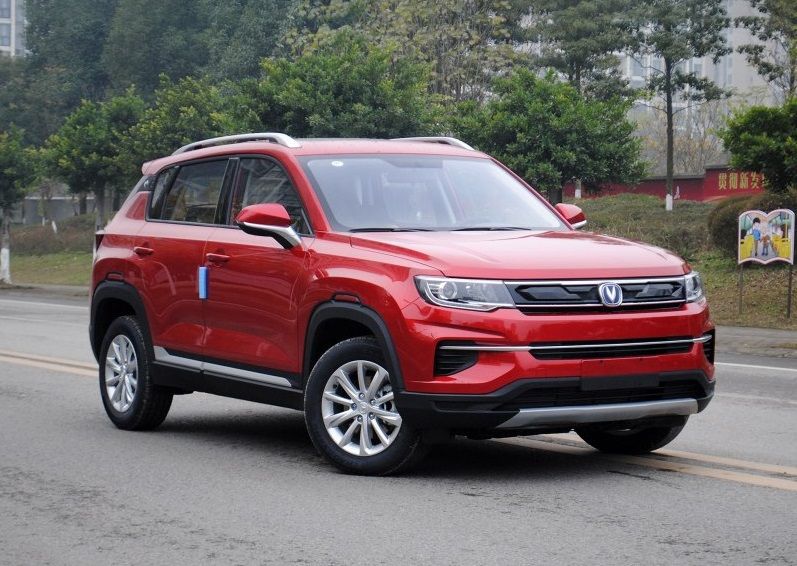
The CS35 is a 5 doors 5 seats SUV with room for 5 people.
How Much Does the Changan CS35 Cost?
The CS35 starts at CN¥68,900 Yuan ($9,646 USD) MSRP. Fully equipped, the CS35 will cost you about CN¥92,900 Yuan ($13,006 USD).
Changan CS35 Engine and Performance
CS35 is powered by a 1.6LL engine that makes 92 Kw (123.37 HP) - 115 Kw (154.22 HP) and 160 Nm (118.40 ft-lb) - 215 Nm (159.10 ft-lb) torque.
Changan CS35 Specifications
The CS35 has a curb weight of 1,300 kg (2,800 lbs) - 1,300 kg (3,000 lbs).
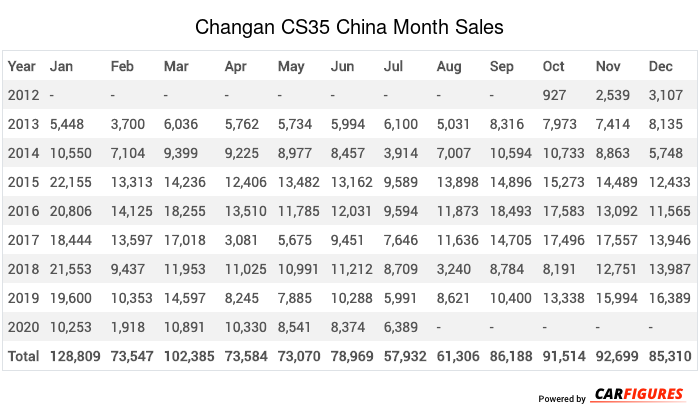
Changan CS35 China Sale figures by year, quarter, and month are presented below. Including the most up to date sales data for the Changan CS35.
| Year | Jan | Feb | Mar | Apr | May | Jun | Jul | Aug | Sep | Oct | Nov | Dec |
|---|---|---|---|---|---|---|---|---|---|---|---|---|
| 2012 | - | - | - | - | - | - | - | - | - | 927 | 2539 | 3107 |
| 2013 | 5448 | 3700 | 6036 | 5762 | 5734 | 5994 | 6100 | 5031 | 8316 | 7973 | 7414 | 8135 |
| 2014 | 10550 | 7104 | 9399 | 9225 | 8977 | 8457 | 3914 | 7007 | 10594 | 10733 | 8863 | 5748 |
| 2015 | 22155 | 13313 | 14236 | 12406 | 13482 | 13162 | 9589 | 13898 | 14896 | 15273 | 14489 | 12433 |
| 2016 | 20806 | 14125 | 18255 | 13510 | 11785 | 12031 | 9594 | 11873 | 18493 | 17583 | 13092 | 11565 |
| 2017 | 18444 | 13597 | 17018 | 3081 | 5675 | 9451 | 7646 | 11636 | 14705 | 17496 | 17557 | 13946 |
| 2018 | 21553 | 9437 | 11953 | 11025 | 10991 | 11212 | 8709 | 3240 | 8784 | 8191 | 12751 | 13987 |
| 2019 | 19600 | 10353 | 14597 | 8245 | 7885 | 10288 | 5991 | 8621 | 10400 | 13338 | 15994 | 16389 |
| 2020 | 10253 | 1918 | 10891 | 10330 | 8541 | 8374 | 6389 | - | - | - | - | - |
| Total | 128809 | 73547 | 102385 | 73584 | 73070 | 78969 | 57932 | 61306 | 86188 | 91514 | 92699 | 85310 |
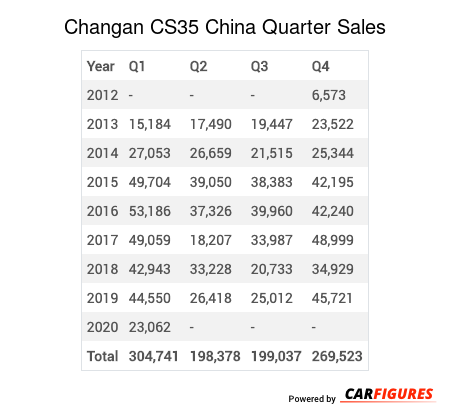
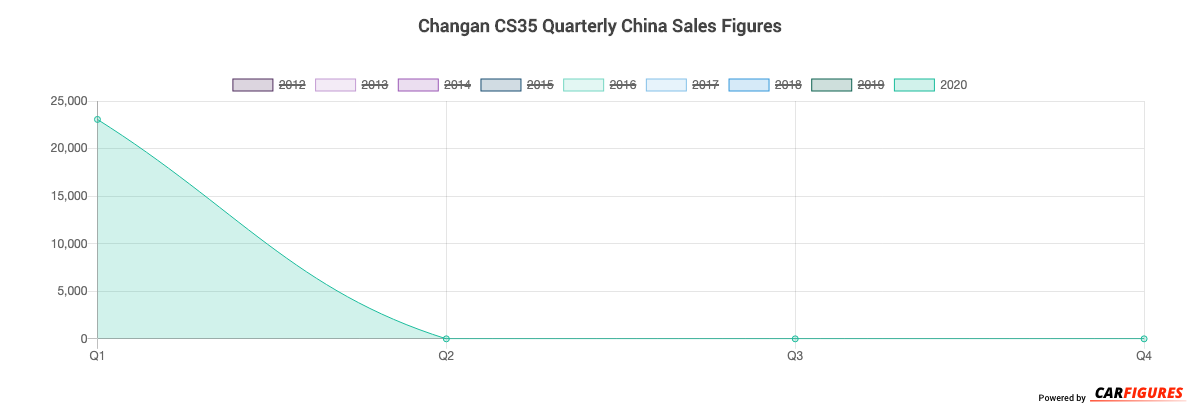
| Year | Q1 | Q2 | Q3 | Q4 |
|---|---|---|---|---|
| 2012 | - | - | - | 6573 |
| 2013 | 15184 | 17490 | 19447 | 23522 |
| 2014 | 27053 | 26659 | 21515 | 25344 |
| 2015 | 49704 | 39050 | 38383 | 42195 |
| 2016 | 53186 | 37326 | 39960 | 42240 |
| 2017 | 49059 | 18207 | 33987 | 48999 |
| 2018 | 42943 | 33228 | 20733 | 34929 |
| 2019 | 44550 | 26418 | 25012 | 45721 |
| 2020 | 23062 | - | - | - |
| Total | 304741 | 198378 | 199037 | 269523 |
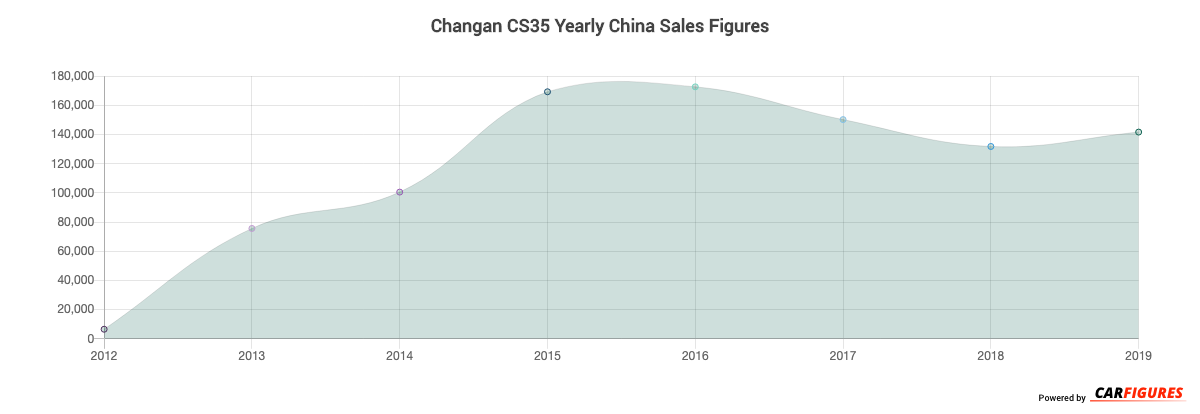
| Year | Sales |
|---|---|
| 2020 | 23062 |
| 2019 | 141701 |
| 2018 | 131833 |
| 2017 | 150252 |
| 2016 | 172712 |
| 2015 | 169332 |
| 2014 | 100571 |
| 2013 | 75643 |
| 2012 | 6573 |
| Total | 971679 |
Download Historic Sales Data
Embedded Code
See more widgetsSources: Manufacturers