Key Stats
How many Teana did Nissan sell in 2020?
Nissan sold 53,335 Teana in 2020. (From Jan - Dec 2020)
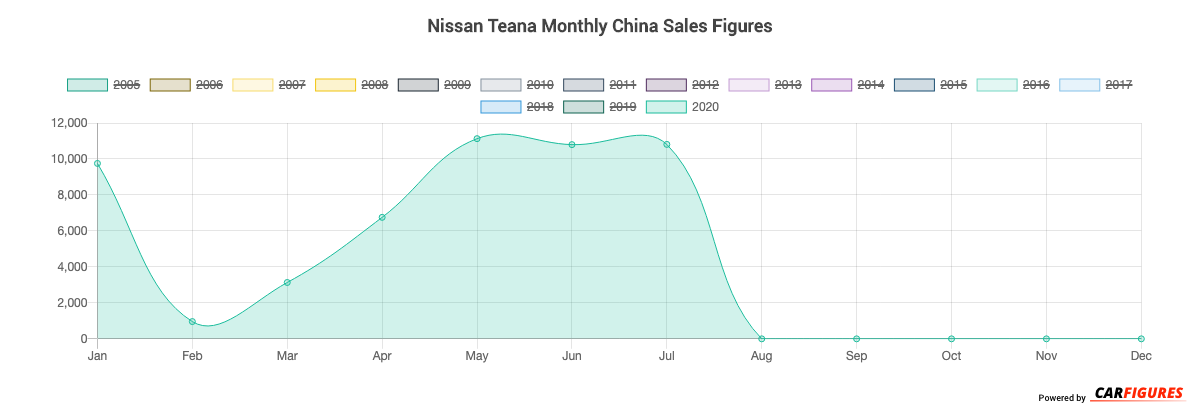
How many Teana did Nissan sell in July 2020?
Nissan sold 10,810 Teana in July 2020.
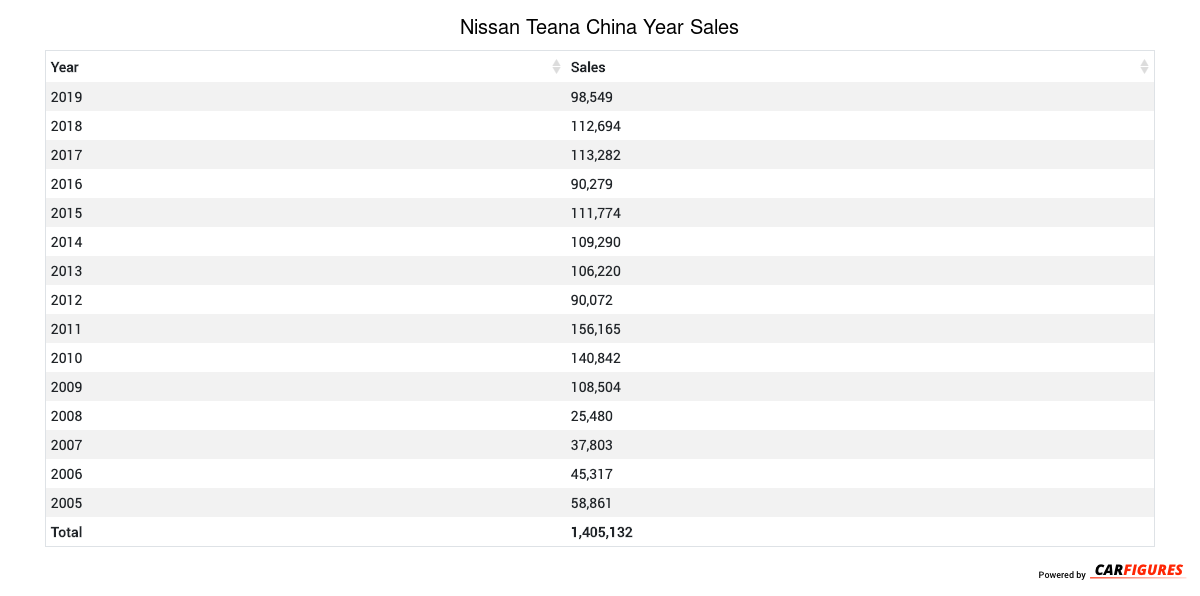
How many Teana did Nissan sell in 2019?
Nissan sold 98,549 Teana in 2019. In 2018, Nissan sold 112,694 Teana. They sold 14,145 more units in year 2018 compared to 2019 with a percent loss of 12.55% YoY.
Overview
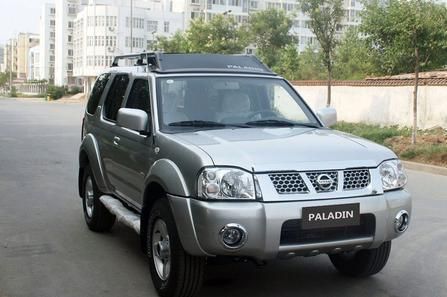
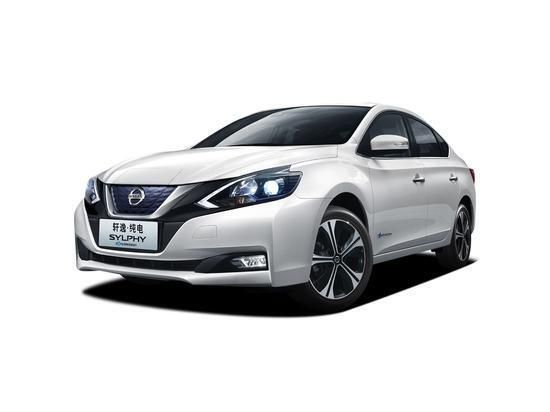
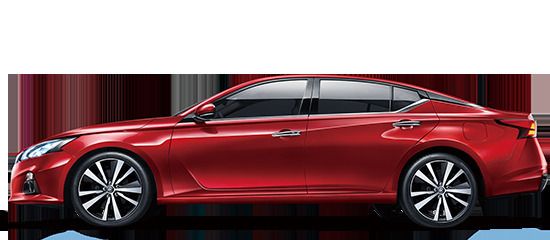
The Teana is a 4-door 5-seater sedan with room for 5 people from automaker Nissan.
How Much Does the Nissan Teana Cost?
Pricing for the Teana starts at CN¥179,800 Yuan ($25,172 USD) MSRP and goes up to CN¥269,800 Yuan ($37,772 USD) fully equipped.
Nissan Teana Engine and Performance
Teana includes a 2.0LL engine. This delivers 110 Kw (147.51 HP) - 185 Kw (248.09 HP) and 195 Nm (144.30 ft-lb) - 380 Nm (281.20 ft-lb) torque.
Nissan Teana Specifications
The Teana has a curb weight of 1,400 kg (3,200 lbs) - 1,600 kg (3,500 lbs).
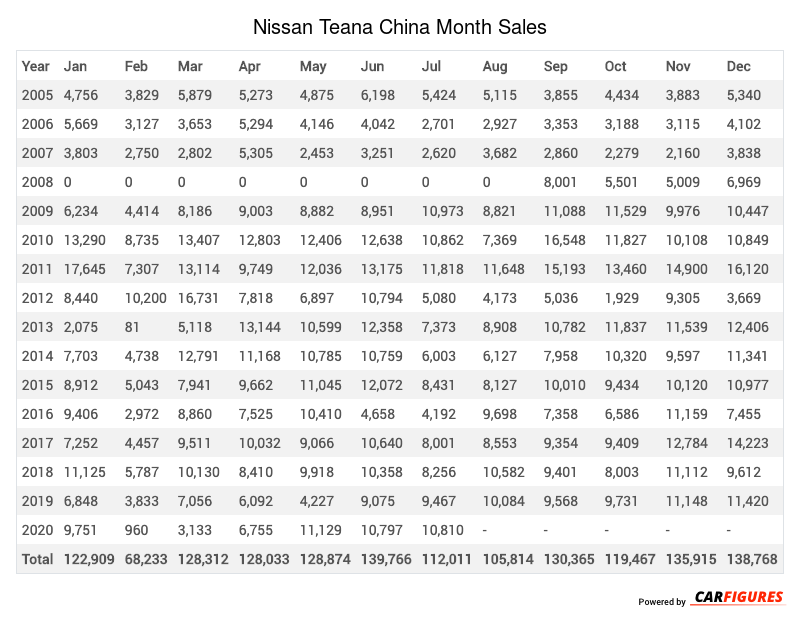
Nissan Teana China Sale figures by year, quarter, and month are presented below. Including the most up to date sales data for the Nissan Teana.
| Year | Jan | Feb | Mar | Apr | May | Jun | Jul | Aug | Sep | Oct | Nov | Dec |
|---|---|---|---|---|---|---|---|---|---|---|---|---|
| 2005 | 4756 | 3829 | 5879 | 5273 | 4875 | 6198 | 5424 | 5115 | 3855 | 4434 | 3883 | 5340 |
| 2006 | 5669 | 3127 | 3653 | 5294 | 4146 | 4042 | 2701 | 2927 | 3353 | 3188 | 3115 | 4102 |
| 2007 | 3803 | 2750 | 2802 | 5305 | 2453 | 3251 | 2620 | 3682 | 2860 | 2279 | 2160 | 3838 |
| 2008 | 0 | 0 | 0 | 0 | 0 | 0 | 0 | 0 | 8001 | 5501 | 5009 | 6969 |
| 2009 | 6234 | 4414 | 8186 | 9003 | 8882 | 8951 | 10973 | 8821 | 11088 | 11529 | 9976 | 10447 |
| 2010 | 13290 | 8735 | 13407 | 12803 | 12406 | 12638 | 10862 | 7369 | 16548 | 11827 | 10108 | 10849 |
| 2011 | 17645 | 7307 | 13114 | 9749 | 12036 | 13175 | 11818 | 11648 | 15193 | 13460 | 14900 | 16120 |
| 2012 | 8440 | 10200 | 16731 | 7818 | 6897 | 10794 | 5080 | 4173 | 5036 | 1929 | 9305 | 3669 |
| 2013 | 2075 | 81 | 5118 | 13144 | 10599 | 12358 | 7373 | 8908 | 10782 | 11837 | 11539 | 12406 |
| 2014 | 7703 | 4738 | 12791 | 11168 | 10785 | 10759 | 6003 | 6127 | 7958 | 10320 | 9597 | 11341 |
| 2015 | 8912 | 5043 | 7941 | 9662 | 11045 | 12072 | 8431 | 8127 | 10010 | 9434 | 10120 | 10977 |
| 2016 | 9406 | 2972 | 8860 | 7525 | 10410 | 4658 | 4192 | 9698 | 7358 | 6586 | 11159 | 7455 |
| 2017 | 7252 | 4457 | 9511 | 10032 | 9066 | 10640 | 8001 | 8553 | 9354 | 9409 | 12784 | 14223 |
| 2018 | 11125 | 5787 | 10130 | 8410 | 9918 | 10358 | 8256 | 10582 | 9401 | 8003 | 11112 | 9612 |
| 2019 | 6848 | 3833 | 7056 | 6092 | 4227 | 9075 | 9467 | 10084 | 9568 | 9731 | 11148 | 11420 |
| 2020 | 9751 | 960 | 3133 | 6755 | 11129 | 10797 | 10810 | - | - | - | - | - |
| Total | 122909 | 68233 | 128312 | 128033 | 128874 | 139766 | 112011 | 105814 | 130365 | 119467 | 135915 | 138768 |
| Year | Q1 | Q2 | Q3 | Q4 |
|---|---|---|---|---|
| 2005 | 14464 | 16346 | 14394 | 13657 |
| 2006 | 12449 | 13482 | 8981 | 10405 |
| 2007 | 9355 | 11009 | 9162 | 8277 |
| 2008 | 0 | 0 | 8001 | 17479 |
| 2009 | 18834 | 26836 | 30882 | 31952 |
| 2010 | 35432 | 37847 | 34779 | 32784 |
| 2011 | 38066 | 34960 | 38659 | 44480 |
| 2012 | 35371 | 25509 | 14289 | 14903 |
| 2013 | 7274 | 36101 | 27063 | 35782 |
| 2014 | 25232 | 32712 | 20088 | 31258 |
| 2015 | 21896 | 32779 | 26568 | 30531 |
| 2016 | 21238 | 22593 | 21248 | 25200 |
| 2017 | 21220 | 29738 | 25908 | 36416 |
| 2018 | 27042 | 28686 | 28239 | 28727 |
| 2019 | 17737 | 19394 | 29119 | 32299 |
| 2020 | 13844 | - | - | - |
| Total | 319454 | 367992 | 337380 | 394150 |
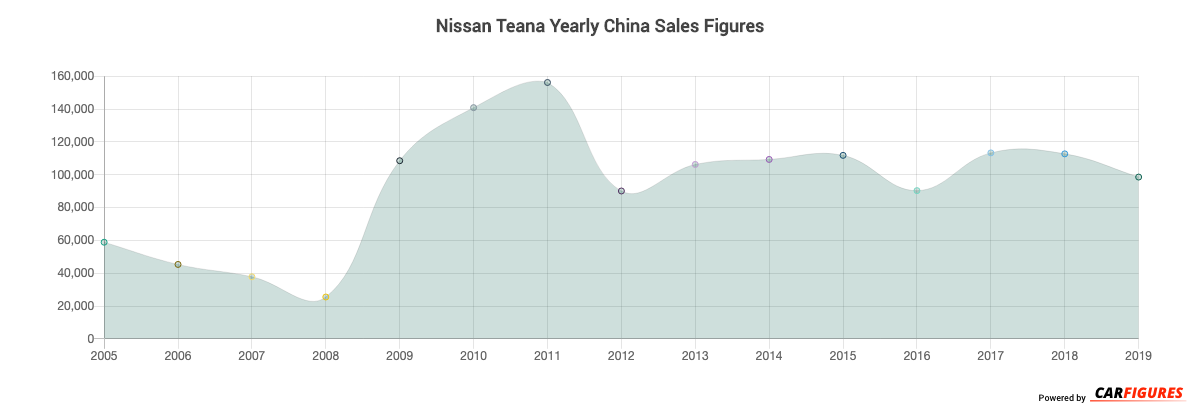
| Year | Sales |
|---|---|
| 2020 | 13844 |
| 2019 | 98549 |
| 2018 | 112694 |
| 2017 | 113282 |
| 2016 | 90279 |
| 2015 | 111774 |
| 2014 | 109290 |
| 2013 | 106220 |
| 2012 | 90072 |
| 2011 | 156165 |
| 2010 | 140842 |
| 2009 | 108504 |
| 2008 | 25480 |
| 2007 | 37803 |
| 2006 | 45317 |
| 2005 | 58861 |
| Total | 1418976 |
Download Historic Sales Data


Embedded Code
See more widgetsSources: Manufacturers