Key Stats
How many ILX did Acura sell in 2023?
Acura sold 2 ILX in 2023. In 2022, Acura sold 6,296 ILX. They sold 6,294 more units in year 2022 compared to 2023 with a percent loss of 99.97% YoY.
Overview
The 2022 Acura ILX is a vehicle from automaker Acura.
How Much Does the 2022 Acura ILX Cost?
Pricing for the 2022 Acura ILX starts at $29,300 MSRP and goes up to $33,200 fully loaded.
Acura ILX Engine, Transmission, and Performance Numbers
Acura ILX includes a 2.4-liter engine combined with an 8-Speed Dual-Clutch. This delivers 201 hp with 180 lb-ft torque delivered through a Front Wheel Drive drivetrain.
List of Acura ILX Competitors
Some of Acura ILX competitors include the Mercedes-Benz A-Class, Audi A3 and Volvo S60.
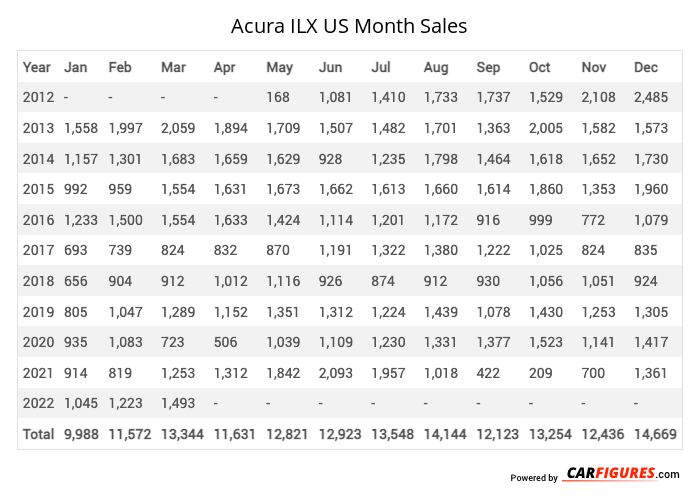
Acura ILX United States Sale figures by year, quarter, and month are presented below. Including the most up to date sales data for the Acura ILX. See how the Acura ILX stacks up the other models in the Cars, Premium Compact Cars segments.
| Year | Jan | Feb | Mar | Apr | May | Jun | Jul | Aug | Sep | Oct | Nov | Dec |
|---|---|---|---|---|---|---|---|---|---|---|---|---|
| 2012 | - | - | - | - | 168 | 1081 | 1410 | 1733 | 1737 | 1529 | 2108 | 2485 |
| 2013 | 1558 | 1997 | 2059 | 1894 | 1709 | 1507 | 1482 | 1701 | 1363 | 2005 | 1582 | 1573 |
| 2014 | 1157 | 1301 | 1683 | 1659 | 1629 | 928 | 1235 | 1798 | 1464 | 1618 | 1652 | 1730 |
| 2015 | 992 | 959 | 1554 | 1631 | 1673 | 1662 | 1613 | 1660 | 1614 | 1860 | 1353 | 1960 |
| 2016 | 1233 | 1500 | 1554 | 1633 | 1424 | 1114 | 1201 | 1172 | 916 | 999 | 772 | 1079 |
| 2017 | 693 | 739 | 824 | 832 | 870 | 1191 | 1322 | 1380 | 1222 | 1025 | 824 | 835 |
| 2018 | 656 | 904 | 912 | 1012 | 1116 | 926 | 874 | 912 | 930 | 1056 | 1051 | 924 |
| 2019 | 805 | 1047 | 1289 | 1152 | 1351 | 1312 | 1224 | 1439 | 1078 | 1430 | 1253 | 1305 |
| 2020 | 935 | 1083 | 723 | 506 | 1039 | 1109 | 1230 | 1331 | 1377 | 1523 | 1141 | 1417 |
| 2021 | 914 | 819 | 1253 | 1312 | 1842 | 2093 | 1957 | 1018 | 422 | 209 | 700 | 1361 |
| 2022 | 1045 | 1223 | 1493 | 1445 | 853 | 208 | 26 | 3 | 0 | 0 | 0 | 0 |
| 2023 | 1 | 1 | 0 | 0 | 0 | 0 | 0 | 0 | 0 | 0 | 0 | 0 |
| 2024 | - | - | - | - | - | - | - | - | - | - | - | - |
| Total | 9989 | 11573 | 13344 | 13076 | 13674 | 13131 | 13574 | 14147 | 12123 | 13254 | 12436 | 14669 |
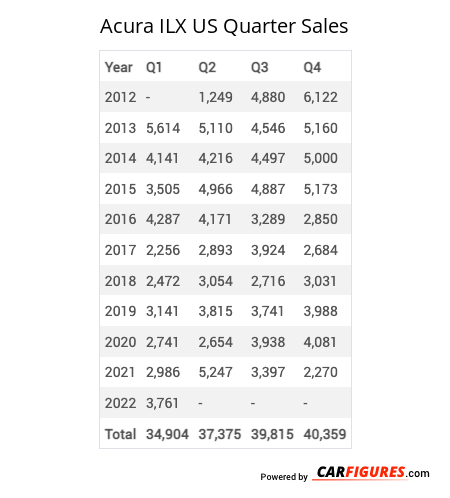
| Year | Q1 | Q2 | Q3 | Q4 |
|---|---|---|---|---|
| 2012 | - | 1249 | 4880 | 6122 |
| 2013 | 5614 | 5110 | 4546 | 5160 |
| 2014 | 4141 | 4216 | 4497 | 5000 |
| 2015 | 3505 | 4966 | 4887 | 5173 |
| 2016 | 4287 | 4171 | 3289 | 2850 |
| 2017 | 2256 | 2893 | 3924 | 2684 |
| 2018 | 2472 | 3054 | 2716 | 3031 |
| 2019 | 3141 | 3815 | 3741 | 3988 |
| 2020 | 2741 | 2654 | 3938 | 4081 |
| 2021 | 2986 | 5247 | 3397 | 2270 |
| 2022 | 3761 | 2506 | 29 | 0 |
| 2023 | 2 | 0 | 0 | 0 |
| 2024 | - | - | - | - |
| Total | 34906 | 39881 | 39844 | 40359 |
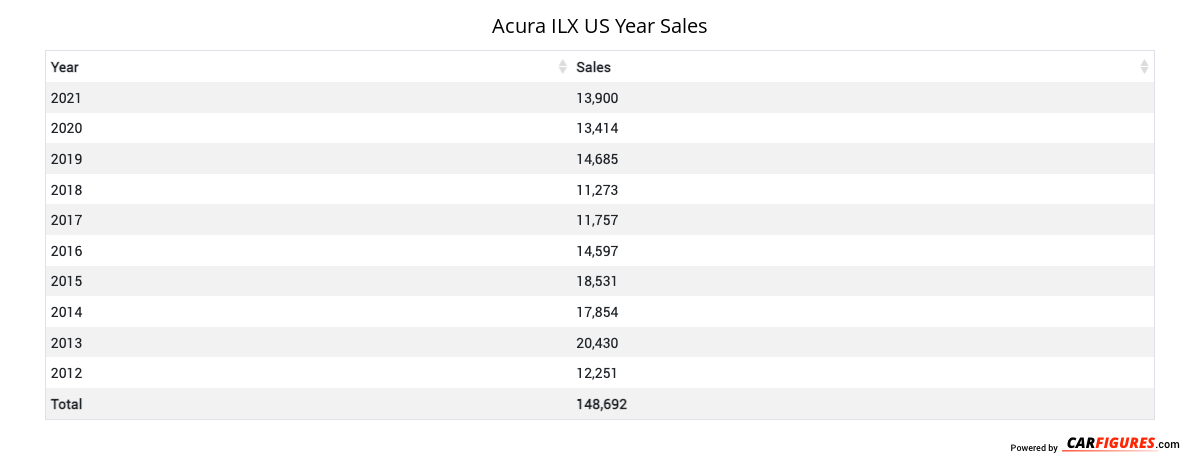
| Year | Sales |
|---|---|
| 2023 | 2 |
| 2022 | 6296 |
| 2021 | 13900 |
| 2020 | 13414 |
| 2019 | 14685 |
| 2018 | 11273 |
| 2017 | 11757 |
| 2016 | 14597 |
| 2015 | 18531 |
| 2014 | 17854 |
| 2013 | 20430 |
| 2012 | 12251 |
| Total | 154990 |
Download Historic Sales Data
Embedded Code
See more widgetsSources: Manufacturers