Key Stats
How many RDX did Acura sell in 2024?
Acura sold 10,117 RDX in 2024. (From Jan - Mar 2024)
How many RDX did Acura sell in March 2024?
Acura sold 4,125 RDX in March 2024.
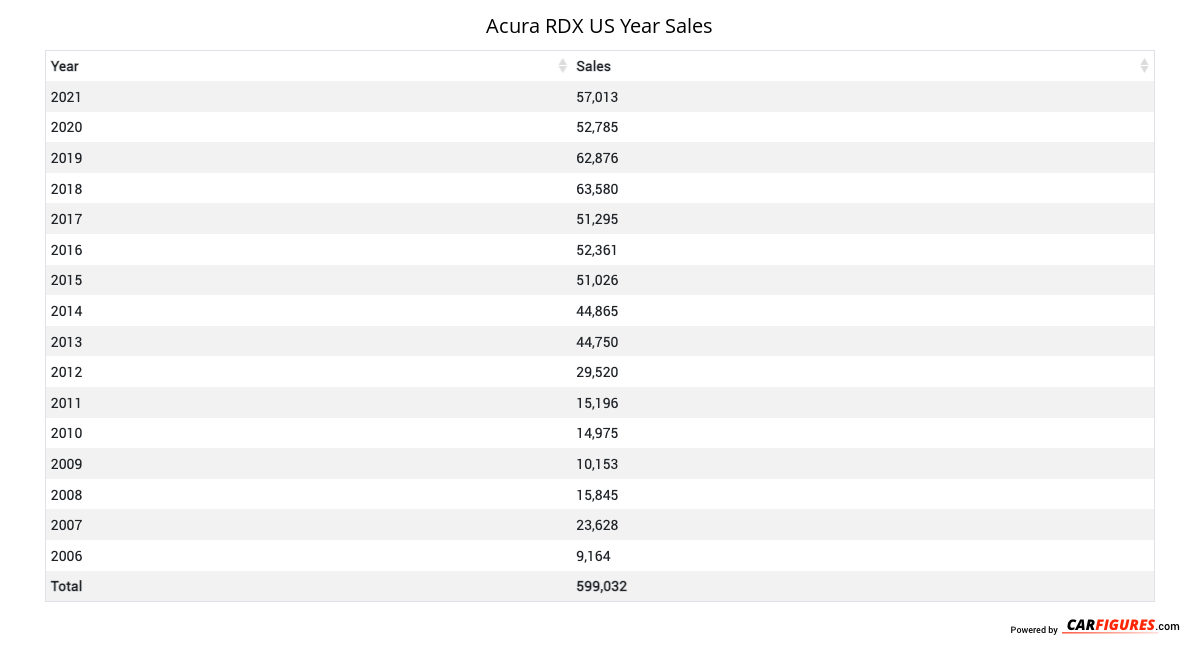
How many RDX did Acura sell in 2023?
Acura sold 39,228 RDX in 2023. In 2022, Acura sold 24,749 RDX. They sold 14,479 more units in 2023 compared to 2022 with a percent gain of 58.5% YoY.
Overview
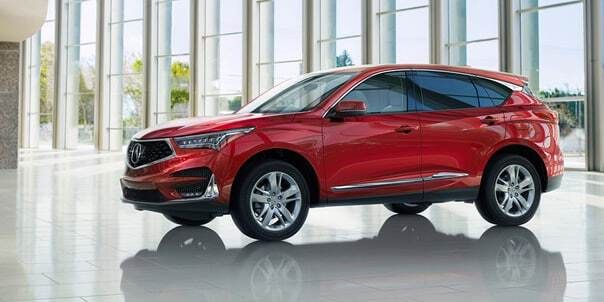
The 2022 Acura RDX is a vehicle from automaker Acura.
How Much Does the 2022 Acura RDX Cost?
The 2022 Acura RDX starts at $42,750 MSRP. Fully loaded, the Acura RDX will cost you about $53,300.
Acura RDX Engine, Transmission, and Performance Numbers
Acura RDX includes a 2.0-liter engine combined with a 10-Speed Automatic. This delivers 272 hp with 280 lb-ft torque delivered through a Front Wheel Drive drivetrain.
List of Acura RDX Competitors
Some of Acura RDX competitors include the Mercedes-Benz GLC-Class, Volvo XC60 and BMW X3.
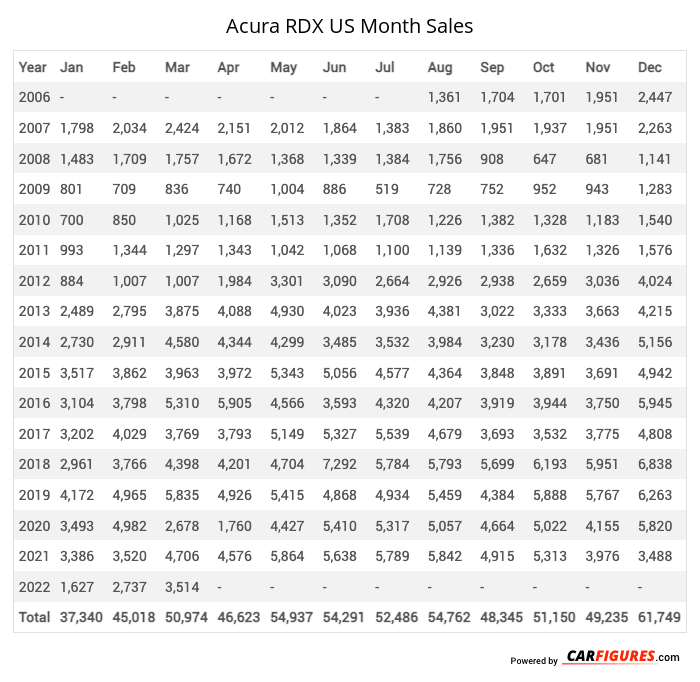
Acura RDX United States Sale figures by year, quarter, and month are presented below. Including the most up to date sales data for the Acura RDX. See how the Acura RDX stacks up the other models in the Crossover/SUVS, Premium Compact Crossover/SUVs segments.
| Year | Jan | Feb | Mar | Apr | May | Jun | Jul | Aug | Sep | Oct | Nov | Dec |
|---|---|---|---|---|---|---|---|---|---|---|---|---|
| 2006 | - | - | - | - | - | - | - | 1361 | 1704 | 1701 | 1951 | 2447 |
| 2007 | 1798 | 2034 | 2424 | 2151 | 2012 | 1864 | 1383 | 1860 | 1951 | 1937 | 1951 | 2263 |
| 2008 | 1483 | 1709 | 1757 | 1672 | 1368 | 1339 | 1384 | 1756 | 908 | 647 | 681 | 1141 |
| 2009 | 801 | 709 | 836 | 740 | 1004 | 886 | 519 | 728 | 752 | 952 | 943 | 1283 |
| 2010 | 700 | 850 | 1025 | 1168 | 1513 | 1352 | 1708 | 1226 | 1382 | 1328 | 1183 | 1540 |
| 2011 | 993 | 1344 | 1297 | 1343 | 1042 | 1068 | 1100 | 1139 | 1336 | 1632 | 1326 | 1576 |
| 2012 | 884 | 1007 | 1007 | 1984 | 3301 | 3090 | 2664 | 2926 | 2938 | 2659 | 3036 | 4024 |
| 2013 | 2489 | 2795 | 3875 | 4088 | 4930 | 4023 | 3936 | 4381 | 3022 | 3333 | 3663 | 4215 |
| 2014 | 2730 | 2911 | 4580 | 4344 | 4299 | 3485 | 3532 | 3984 | 3230 | 3178 | 3436 | 5156 |
| 2015 | 3517 | 3862 | 3963 | 3972 | 5343 | 5056 | 4577 | 4364 | 3848 | 3891 | 3691 | 4942 |
| 2016 | 3104 | 3798 | 5310 | 5905 | 4566 | 3593 | 4320 | 4207 | 3919 | 3944 | 3750 | 5945 |
| 2017 | 3202 | 4029 | 3769 | 3793 | 5149 | 5327 | 5539 | 4679 | 3693 | 3532 | 3775 | 4808 |
| 2018 | 2961 | 3766 | 4398 | 4201 | 4704 | 7292 | 5784 | 5793 | 5699 | 6193 | 5951 | 6838 |
| 2019 | 4172 | 4965 | 5835 | 4926 | 5415 | 4868 | 4934 | 5459 | 4384 | 5888 | 5767 | 6263 |
| 2020 | 3493 | 4982 | 2678 | 1760 | 4427 | 5410 | 5317 | 5057 | 4664 | 5022 | 4155 | 5820 |
| 2021 | 3386 | 3520 | 4706 | 4576 | 5864 | 5638 | 5789 | 5842 | 4915 | 5313 | 3976 | 3488 |
| 2022 | 1627 | 2737 | 3514 | 2857 | 1638 | 1866 | 1575 | 1960 | 1962 | 1557 | 1087 | 2369 |
| 2023 | 1848 | 2090 | 2871 | 2573 | 2791 | 3502 | 3292 | 3962 | 4273 | 4200 | 3692 | 4134 |
| 2024 | 2777 | 3215 | 4125 | - | - | - | - | - | - | - | - | - |
| Total | 41965 | 50323 | 57970 | 52053 | 59366 | 59659 | 57353 | 60684 | 54580 | 56907 | 54014 | 68252 |
| Year | Q1 | Q2 | Q3 | Q4 |
|---|---|---|---|---|
| 2006 | - | - | 3065 | 6099 |
| 2007 | 6256 | 6027 | 5194 | 6151 |
| 2008 | 4949 | 4379 | 4048 | 2469 |
| 2009 | 2346 | 2630 | 1999 | 3178 |
| 2010 | 2575 | 4033 | 4316 | 4051 |
| 2011 | 3634 | 3453 | 3575 | 4534 |
| 2012 | 2898 | 8375 | 8528 | 9719 |
| 2013 | 9159 | 13041 | 11339 | 11211 |
| 2014 | 10221 | 12128 | 10746 | 11770 |
| 2015 | 11342 | 14371 | 12789 | 12524 |
| 2016 | 12212 | 14064 | 12446 | 13639 |
| 2017 | 11000 | 14269 | 13911 | 12115 |
| 2018 | 11125 | 16197 | 17276 | 18982 |
| 2019 | 14972 | 15209 | 14777 | 17918 |
| 2020 | 11153 | 11597 | 15038 | 14997 |
| 2021 | 11612 | 16078 | 16546 | 12777 |
| 2022 | 7878 | 6361 | 5497 | 5013 |
| 2023 | 6809 | 8866 | 11527 | 12026 |
| 2024 | 10117 | - | - | - |
| Total | 150258 | 171078 | 172617 | 179173 |
| Year | Sales |
|---|---|
| 2023 | 39228 |
| 2022 | 24749 |
| 2021 | 57013 |
| 2020 | 52785 |
| 2019 | 62876 |
| 2018 | 63580 |
| 2017 | 51295 |
| 2016 | 52361 |
| 2015 | 51026 |
| 2014 | 44865 |
| 2013 | 44750 |
| 2012 | 29520 |
| 2011 | 15196 |
| 2010 | 14975 |
| 2009 | 10153 |
| 2008 | 15845 |
| 2007 | 23628 |
| 2006 | 9164 |
| Total | 663009 |
Download Historic Sales Data

Embedded Code
See more widgetsSources: Manufacturers