
Key Stats
How many Q3 did Audi sell in 2024?
Audi sold 5,274 Q3 in 2024. (From Jan - Mar 2024)
How many Q3 did Audi sell in Q1 2024?
Audi sold 5,274 Q3 in Q1 2024.
How many Q3 did Audi sell in 2023?
Audi sold 16,732 Q3 in 2023. In 2022, Audi sold 23,045 Q3. They sold 6,313 more units in year 2022 compared to 2023 with a percent loss of 27.39% YoY.
Overview
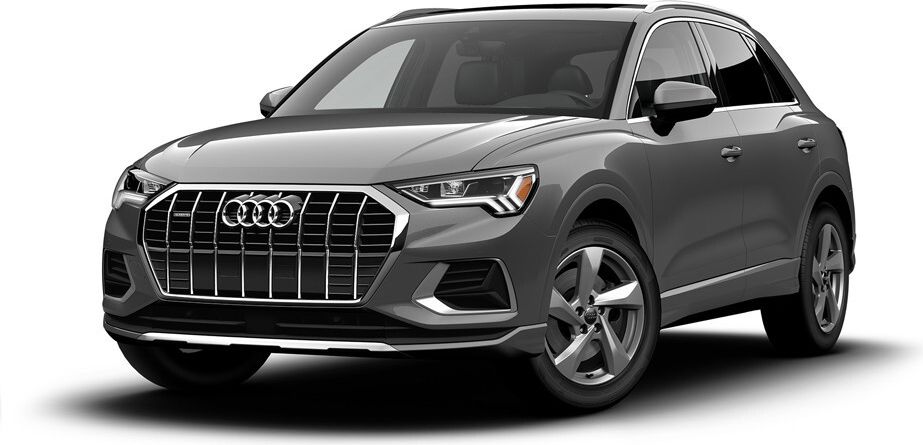
The 2022 Audi Q3 is a vehicle from automaker Audi.
How Much Does the 2022 Audi Q3 Cost?
The 2022 Audi Q3 starts at $35,900 MSRP. Fully loaded, the Audi Q3 will cost you about $38,200.
Audi Q3 Engine, Transmission, and Performance Numbers
Audi Q3 includes a 2.0-liter engine combined with an 8-Speed Tiptronic Automatic. This delivers 184 hp with 221 lb-ft torque delivered through a All Wheel Drive drivetrain.
List of Audi Q3 Competitors
Some of Audi Q3 competitors include the Mercedes-Benz GLC-Class and Volvo XC40.
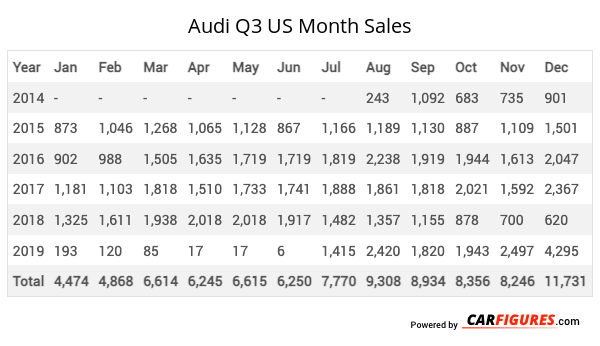
Audi Q3 United States Sale figures by year, quarter, and month are presented below. Including the most up to date sales data for the Audi Q3. See how the Audi Q3 stacks up the other models in the Crossover/SUVS, Premium Subcompact Crossover/SUVs segments.
| Year | Jan | Feb | Mar | Apr | May | Jun | Jul | Aug | Sep | Oct | Nov | Dec |
|---|---|---|---|---|---|---|---|---|---|---|---|---|
| 2014 | - | - | - | - | - | - | - | 243 | 1092 | 683 | 735 | 901 |
| 2015 | 873 | 1046 | 1268 | 1065 | 1128 | 867 | 1166 | 1189 | 1130 | 887 | 1109 | 1501 |
| 2016 | 902 | 988 | 1505 | 1635 | 1719 | 1719 | 1819 | 2238 | 1919 | 1944 | 1613 | 2047 |
| 2017 | 1181 | 1103 | 1818 | 1510 | 1733 | 1741 | 1888 | 1861 | 1818 | 2021 | 1592 | 2367 |
| 2018 | 1325 | 1611 | 1938 | 2018 | 2018 | 1917 | 1482 | 1357 | 1155 | 878 | 700 | 620 |
| 2019 | 193 | 120 | 85 | 17 | 17 | 6 | 1415 | 2420 | 1820 | 1943 | 2497 | 4295 |
| Total | 4474 | 4868 | 6614 | 6245 | 6615 | 6250 | 7770 | 9308 | 8934 | 8356 | 8246 | 11731 |
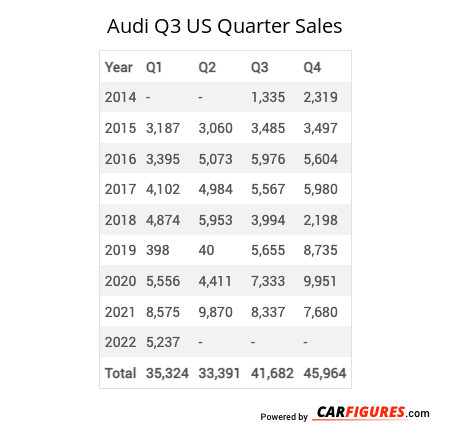
| Year | Q1 | Q2 | Q3 | Q4 |
|---|---|---|---|---|
| 2014 | - | - | 1335 | 2319 |
| 2015 | 3187 | 3060 | 3485 | 3497 |
| 2016 | 3395 | 5073 | 5976 | 5604 |
| 2017 | 4102 | 4984 | 5567 | 5980 |
| 2018 | 4874 | 5953 | 3994 | 2198 |
| 2019 | 398 | 40 | 5655 | 8735 |
| 2020 | 5556 | 4411 | 7333 | 9951 |
| 2021 | 8575 | 9870 | 8337 | 7680 |
| 2022 | 5237 | 6387 | 4980 | 6441 |
| 2023 | 3855 | 5070 | 0 | 7807 |
| 2024 | 5274 | - | - | - |
| Total | 44453 | 44848 | 46662 | 60212 |
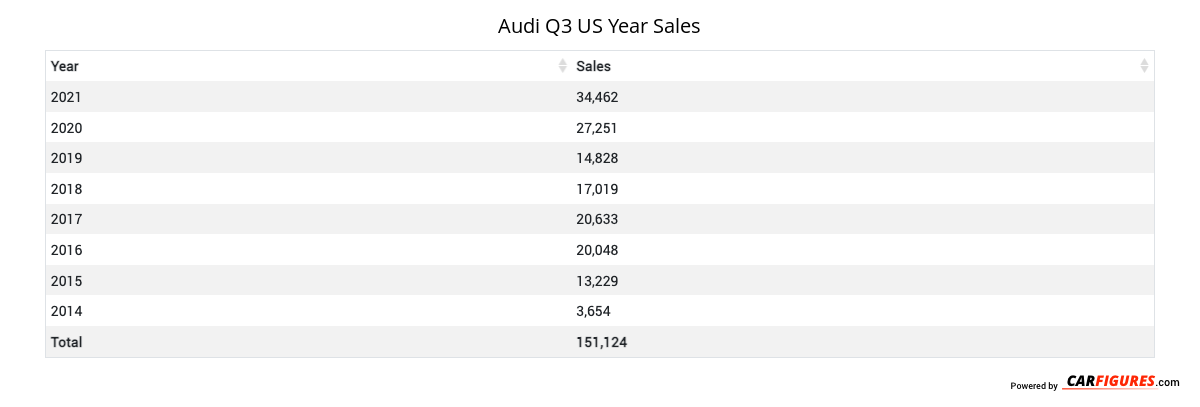
| Year | Sales |
|---|---|
| 2023 | 16732 |
| 2022 | 23045 |
| 2021 | 34462 |
| 2020 | 27251 |
| 2019 | 14828 |
| 2018 | 17019 |
| 2017 | 20633 |
| 2016 | 20048 |
| 2015 | 13229 |
| 2014 | 3654 |
| Total | 190901 |
Download Historic Sales Data
Embedded Code
See more widgetsSources: Manufacturers