Key Stats
How many R8 did Audi sell in 2024?
Audi sold 182 R8 in 2024. (From Jan - Mar 2024)
How many R8 did Audi sell in Q1 2024?
Audi sold 182 R8 in Q1 2024.
How many R8 did Audi sell in 2023?
Audi sold 441 R8 in 2023. In 2022, Audi sold 299 R8. They sold 142 more units in 2023 compared to 2022 with a percent gain of 47.49% YoY.
Overview
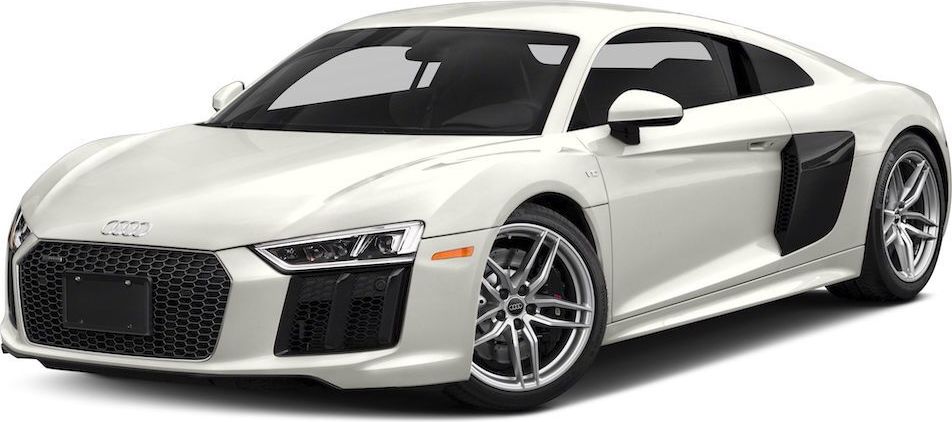
The 2022 Audi R8 is a vehicle from automaker Audi.
How Much Does the 2022 Audi R8 Cost?
Pricing for the 2022 Audi R8 starts at $148,700 MSRP and goes up to $213,500 fully loaded.
Audi R8 Engine, Transmission, and Performance Numbers
Audi R8 includes a 5.2-liter engine combined with a 7-Speed S tronic. This delivers 562 hp with 406 lb-ft torque delivered through a Rear Wheel Drive drivetrain.
List of Audi R8 Competitors
Some of Audi R8 competitors include the Porsche 911, Acura NSX and Mercedes-Benz AMG GT.
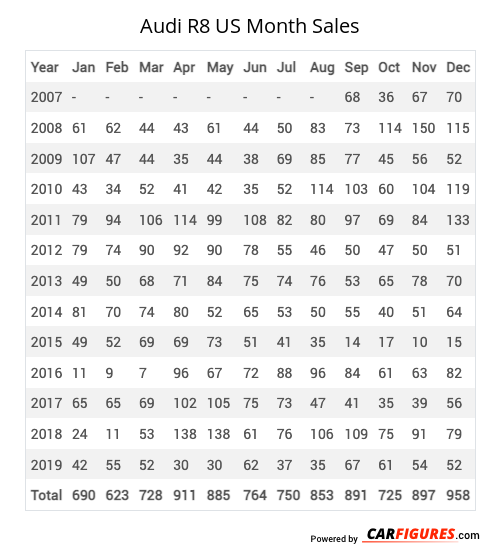
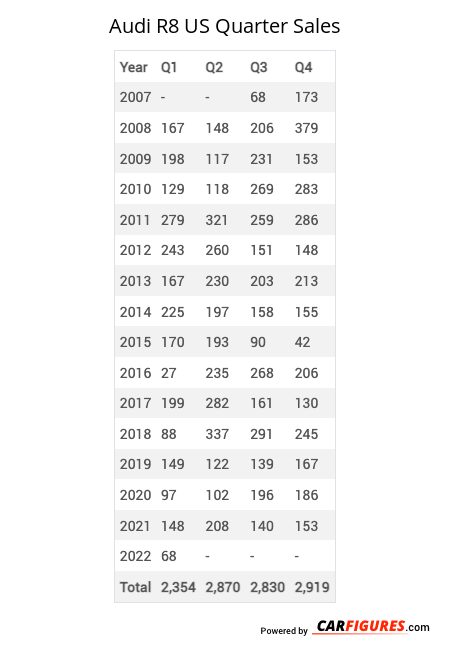
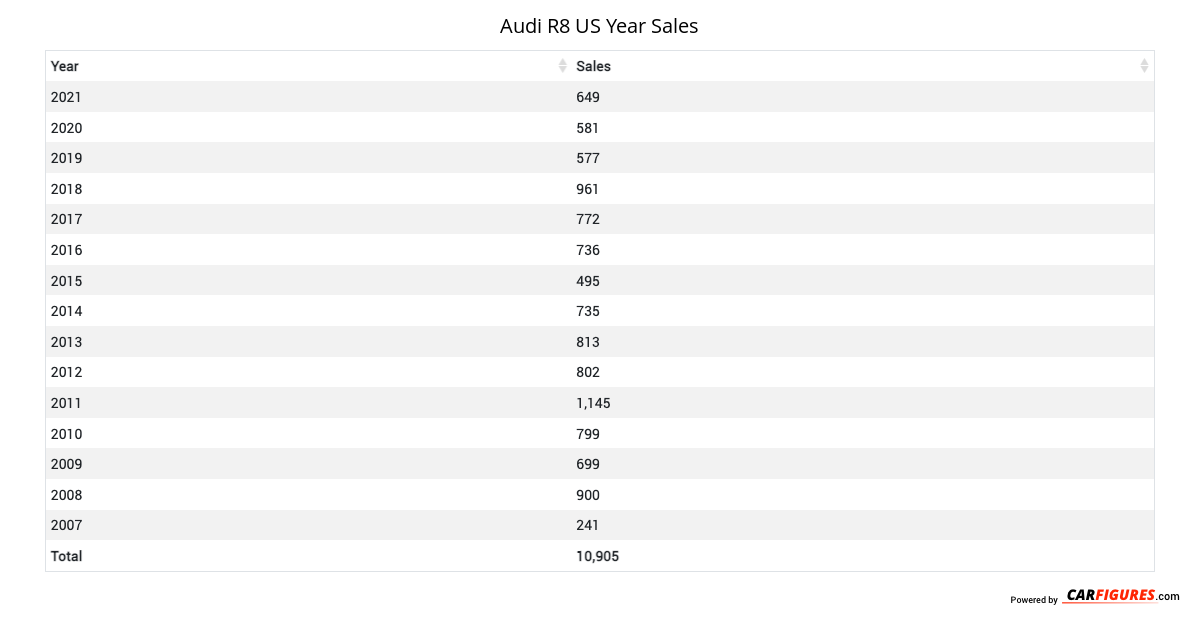
Audi R8 United States Sale figures by year, quarter, and month are presented below. Including the most up to date sales data for the Audi R8. See how the Audi R8 stacks up the other models in the Cars, Exotic Vehicles, Premium Sport/Performance Cars segments.
*Sales report includes R8 Coupe, R8 Spyder
| Year | Jan | Feb | Mar | Apr | May | Jun | Jul | Aug | Sep | Oct | Nov | Dec |
|---|---|---|---|---|---|---|---|---|---|---|---|---|
| 2007 | - | - | - | - | - | - | - | - | 68 | 36 | 67 | 70 |
| 2008 | 61 | 62 | 44 | 43 | 61 | 44 | 50 | 83 | 73 | 114 | 150 | 115 |
| 2009 | 107 | 47 | 44 | 35 | 44 | 38 | 69 | 85 | 77 | 45 | 56 | 52 |
| 2010 | 43 | 34 | 52 | 41 | 42 | 35 | 52 | 114 | 103 | 60 | 104 | 119 |
| 2011 | 79 | 94 | 106 | 114 | 99 | 108 | 82 | 80 | 97 | 69 | 84 | 133 |
| 2012 | 79 | 74 | 90 | 92 | 90 | 78 | 55 | 46 | 50 | 47 | 50 | 51 |
| 2013 | 49 | 50 | 68 | 71 | 84 | 75 | 74 | 76 | 53 | 65 | 78 | 70 |
| 2014 | 81 | 70 | 74 | 80 | 52 | 65 | 53 | 50 | 55 | 40 | 51 | 64 |
| 2015 | 49 | 52 | 69 | 69 | 73 | 51 | 41 | 35 | 14 | 17 | 10 | 15 |
| 2016 | 11 | 9 | 7 | 96 | 67 | 72 | 88 | 96 | 84 | 61 | 63 | 82 |
| 2017 | 65 | 65 | 69 | 102 | 105 | 75 | 73 | 47 | 41 | 35 | 39 | 56 |
| 2018 | 24 | 11 | 53 | 138 | 138 | 61 | 76 | 106 | 109 | 75 | 91 | 79 |
| 2019 | 42 | 55 | 52 | 30 | 30 | 62 | 37 | 35 | 67 | 61 | 54 | 52 |
| Total | 690 | 623 | 728 | 911 | 885 | 764 | 750 | 853 | 891 | 725 | 897 | 958 |
| Year | Q1 | Q2 | Q3 | Q4 |
|---|---|---|---|---|
| 2007 | - | - | 68 | 173 |
| 2008 | 167 | 148 | 206 | 379 |
| 2009 | 198 | 117 | 231 | 153 |
| 2010 | 129 | 118 | 269 | 283 |
| 2011 | 279 | 321 | 259 | 286 |
| 2012 | 243 | 260 | 151 | 148 |
| 2013 | 167 | 230 | 203 | 213 |
| 2014 | 225 | 197 | 158 | 155 |
| 2015 | 170 | 193 | 90 | 42 |
| 2016 | 27 | 235 | 268 | 206 |
| 2017 | 199 | 282 | 161 | 130 |
| 2018 | 88 | 337 | 291 | 245 |
| 2019 | 149 | 122 | 139 | 167 |
| 2020 | 97 | 102 | 196 | 186 |
| 2021 | 148 | 208 | 140 | 153 |
| 2022 | 68 | 91 | 32 | 108 |
| 2023 | 97 | 89 | 0 | 255 |
| 2024 | 182 | - | - | - |
| Total | 2633 | 3050 | 2862 | 3282 |
| Year | Sales |
|---|---|
| 2023 | 441 |
| 2022 | 299 |
| 2021 | 649 |
| 2020 | 581 |
| 2019 | 577 |
| 2018 | 961 |
| 2017 | 772 |
| 2016 | 736 |
| 2015 | 495 |
| 2014 | 735 |
| 2013 | 813 |
| 2012 | 802 |
| 2011 | 1145 |
| 2010 | 799 |
| 2009 | 699 |
| 2008 | 900 |
| 2007 | 241 |
| Total | 11645 |
Download Historic Sales Data
Embedded Code
See more widgetsSources: Manufacturers