Key Stats
How many X6 did BMW sell in 2023?
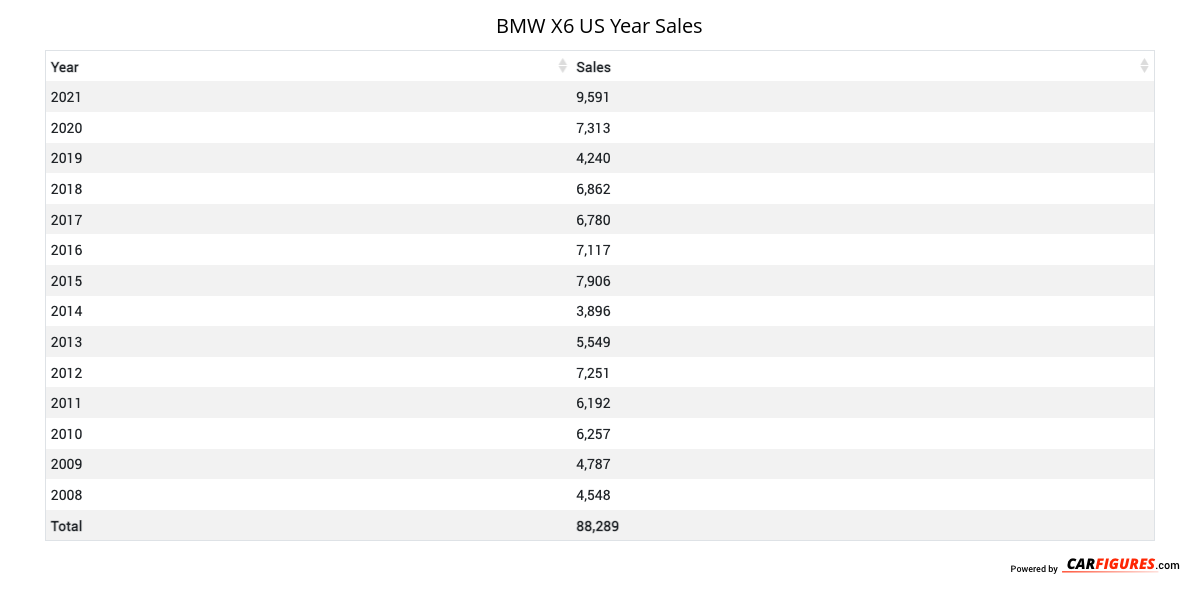
BMW sold 7,914 X6 in 2023. In 2022, BMW sold 13,675 X6. They sold 5,761 more units in year 2022 compared to 2023 with a percent loss of 42.13% YoY.
Overview
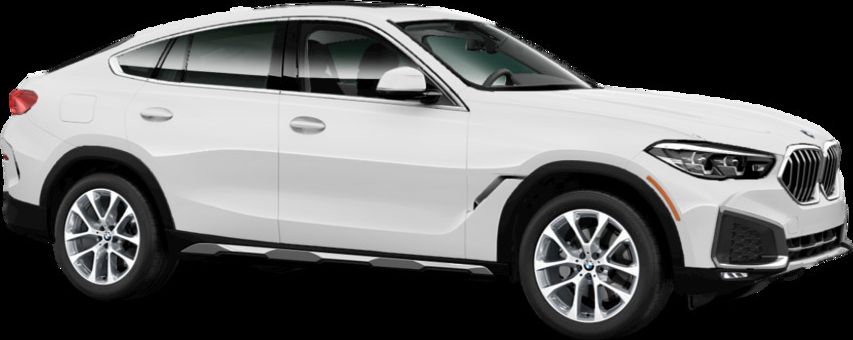
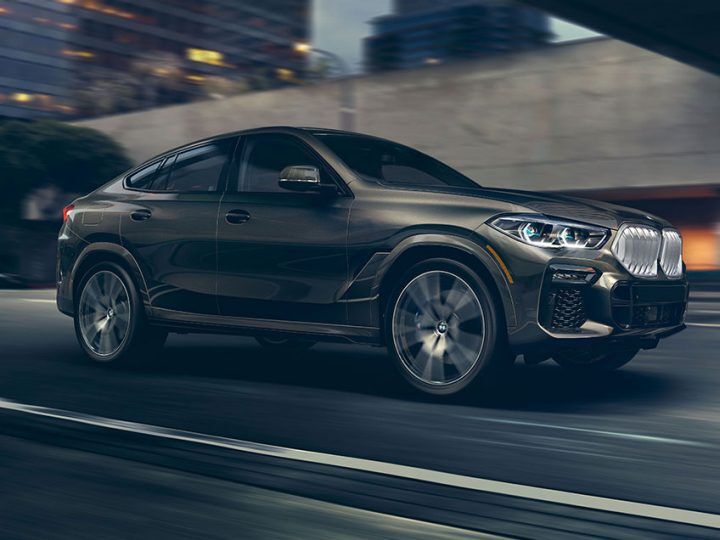
The 2024 BMW X6 is a vehicle from automaker BMW.
How Much Does the 2024 BMW X6 Cost?
Pricing for the 2024 BMW X6 starts at $73,900 MSRP and goes up to $93,600 fully loaded.
BMW X6 Engine, Transmission, and Performance Numbers
BMW X6 includes a 3.0-liter engine combined with an 8-Speed Sport Automatic. This delivers 375 hp with 398 lb-ft torque delivered through a All Wheel Drive drivetrain.
List of BMW X6 Competitors
Some of BMW X6 competitors include the BMW X5, BMW X4 and Porsche Cayenne.
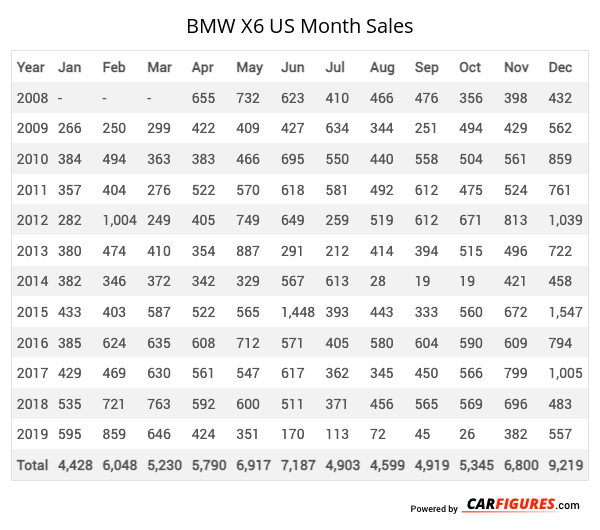
BMW X6 United States Sale figures by year, quarter, and month are presented below. Including the most up to date sales data for the BMW X6. See how the BMW X6 stacks up the other models in the Crossover/SUVS, Premium Midsize Crossover/SUVs segments.
| Year | Jan | Feb | Mar | Apr | May | Jun | Jul | Aug | Sep | Oct | Nov | Dec |
|---|---|---|---|---|---|---|---|---|---|---|---|---|
| 2008 | - | - | - | 655 | 732 | 623 | 410 | 466 | 476 | 356 | 398 | 432 |
| 2009 | 266 | 250 | 299 | 422 | 409 | 427 | 634 | 344 | 251 | 494 | 429 | 562 |
| 2010 | 384 | 494 | 363 | 383 | 466 | 695 | 550 | 440 | 558 | 504 | 561 | 859 |
| 2011 | 357 | 404 | 276 | 522 | 570 | 618 | 581 | 492 | 612 | 475 | 524 | 761 |
| 2012 | 282 | 1004 | 249 | 405 | 749 | 649 | 259 | 519 | 612 | 671 | 813 | 1039 |
| 2013 | 380 | 474 | 410 | 354 | 887 | 291 | 212 | 414 | 394 | 515 | 496 | 722 |
| 2014 | 382 | 346 | 372 | 342 | 329 | 567 | 613 | 28 | 19 | 19 | 421 | 458 |
| 2015 | 433 | 403 | 587 | 522 | 565 | 1448 | 393 | 443 | 333 | 560 | 672 | 1547 |
| 2016 | 385 | 624 | 635 | 608 | 712 | 571 | 405 | 580 | 604 | 590 | 609 | 794 |
| 2017 | 429 | 469 | 630 | 561 | 547 | 617 | 362 | 345 | 450 | 566 | 799 | 1005 |
| 2018 | 535 | 721 | 763 | 592 | 600 | 511 | 371 | 456 | 565 | 569 | 696 | 483 |
| 2019 | 595 | 859 | 646 | 424 | 351 | 170 | 113 | 72 | 45 | 26 | 382 | 557 |
| Total | 4428 | 6048 | 5230 | 5790 | 6917 | 7187 | 4903 | 4599 | 4919 | 5345 | 6800 | 9219 |
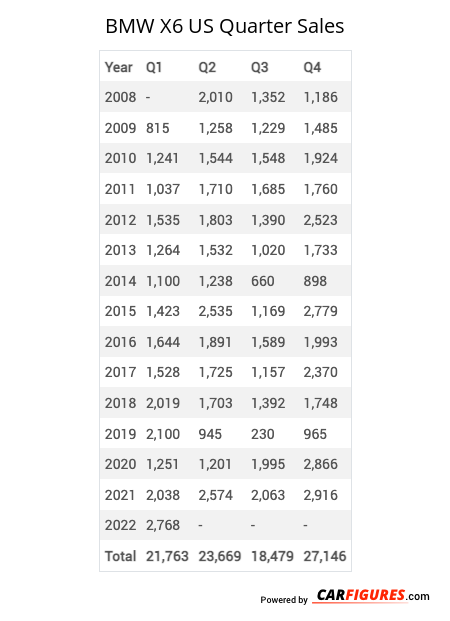
| Year | Q1 | Q2 | Q3 | Q4 |
|---|---|---|---|---|
| 2008 | - | 2010 | 1352 | 1186 |
| 2009 | 815 | 1258 | 1229 | 1485 |
| 2010 | 1241 | 1544 | 1548 | 1924 |
| 2011 | 1037 | 1710 | 1685 | 1760 |
| 2012 | 1535 | 1803 | 1390 | 2523 |
| 2013 | 1264 | 1532 | 1020 | 1733 |
| 2014 | 1100 | 1238 | 660 | 898 |
| 2015 | 1423 | 2535 | 1169 | 2779 |
| 2016 | 1644 | 1891 | 1589 | 1993 |
| 2017 | 1528 | 1725 | 1157 | 2370 |
| 2018 | 2019 | 1703 | 1392 | 1748 |
| 2019 | 2100 | 945 | 230 | 965 |
| 2020 | 1251 | 1201 | 1995 | 2866 |
| 2021 | 2038 | 2574 | 2063 | 2916 |
| 2022 | 2768 | 2631 | 3810 | 4466 |
| 2023 | 2286 | 2612 | 0 | 3016 |
| 2024 | - | - | - | - |
| Total | 24049 | 28912 | 22289 | 34628 |
| Year | Sales |
|---|---|
| 2023 | 7914 |
| 2022 | 13675 |
| 2021 | 9591 |
| 2020 | 7313 |
| 2019 | 4240 |
| 2018 | 6862 |
| 2017 | 6780 |
| 2016 | 7117 |
| 2015 | 7906 |
| 2014 | 3896 |
| 2013 | 5549 |
| 2012 | 7251 |
| 2011 | 6192 |
| 2010 | 6257 |
| 2009 | 4787 |
| 2008 | 4548 |
| Total | 109878 |
Download Historic Sales Data
Embedded Code
See more widgetsSources: Manufacturers