
Key Stats
How many Bolt EV did Chevrolet sell in 2024?
Chevrolet sold 7,040 Bolt EV in 2024. (From Jan - Mar 2024)
How many Bolt EV did Chevrolet sell in Q1 2024?
Chevrolet sold 7,040 Bolt EV in Q1 2024.
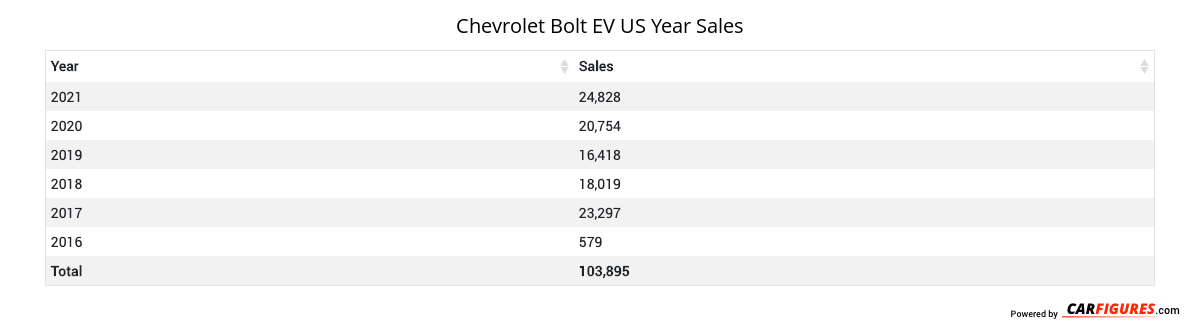
How many Bolt EV did Chevrolet sell in 2023?
Chevrolet sold 46,210 Bolt EV in 2023. In 2022, Chevrolet sold 38,122 Bolt EV. They sold 8,088 more units in 2023 compared to 2022 with a percent gain of 21.22% YoY.
Overview
The 2022 Chevrolet Bolt EV is a vehicle from automaker Chevrolet.
How Much Does the 2022 Chevrolet Bolt EV Cost?
The 2022 Chevrolet Bolt EV starts at $31,500 MSRP. Fully loaded, the Chevrolet Bolt EV will cost you about $34,700.
Chevrolet Bolt EV Engine, Transmission, and Performance Numbers
Chevrolet Bolt EV is powered by a -liter engine with a Front Wheel Drive powertrain that makes 200 -hp and 266 lb-ft torque. The transmission on the Chevrolet Bolt EV is an.
List of Chevrolet Bolt EV Competitors
Some of Chevrolet Bolt EV competitors include the Nissan Leaf and Tesla Model 3.
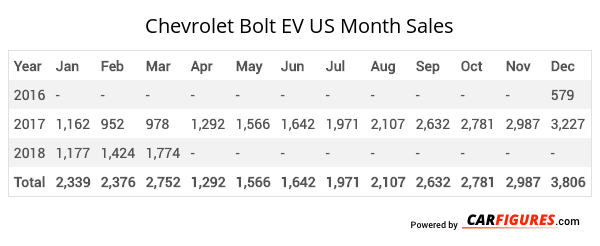
Chevrolet Bolt EV United States Sale figures by year, quarter, and month are presented below. Including the most up to date sales data for the Chevrolet Bolt EV. See how the Chevrolet Bolt EV stacks up the other models in the Cars, Electric Vehicles, Subcompact Cars segments.
| Year | Jan | Feb | Mar | Apr | May | Jun | Jul | Aug | Sep | Oct | Nov | Dec |
|---|---|---|---|---|---|---|---|---|---|---|---|---|
| 2016 | - | - | - | - | - | - | - | - | - | - | - | 579 |
| 2017 | 1162 | 952 | 978 | 1292 | 1566 | 1642 | 1971 | 2107 | 2632 | 2781 | 2987 | 3227 |
| 2018 | 1177 | 1424 | 1774 | - | - | - | - | - | - | - | - | - |
| Total | 2339 | 2376 | 2752 | 1292 | 1566 | 1642 | 1971 | 2107 | 2632 | 2781 | 2987 | 3806 |
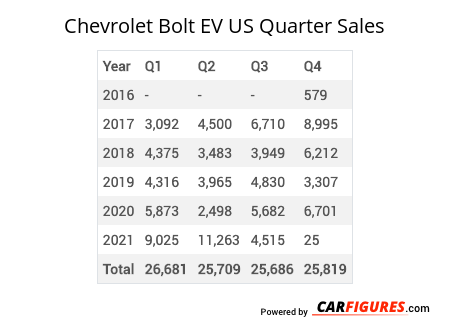
| Year | Q1 | Q2 | Q3 | Q4 |
|---|---|---|---|---|
| 2016 | - | - | - | 579 |
| 2017 | 3092 | 4500 | 6710 | 8995 |
| 2018 | 4375 | 3483 | 3949 | 6212 |
| 2019 | 4316 | 3965 | 4830 | 3307 |
| 2020 | 5873 | 2498 | 5682 | 6701 |
| 2021 | 9025 | 11263 | 4515 | 25 |
| 2022 | 359 | 6946 | 14709 | 16108 |
| 2023 | 19700 | 13958 | 0 | 12552 |
| 2024 | 7040 | - | - | - |
| Total | 53780 | 46613 | 40395 | 54479 |
| Year | Sales |
|---|---|
| 2023 | 46210 |
| 2022 | 38122 |
| 2021 | 24828 |
| 2020 | 20754 |
| 2019 | 16418 |
| 2018 | 18019 |
| 2017 | 23297 |
| 2016 | 579 |
| Total | 188227 |
Download Historic Sales Data
Embedded Code
See more widgetsSources: Manufacturers