Key Stats
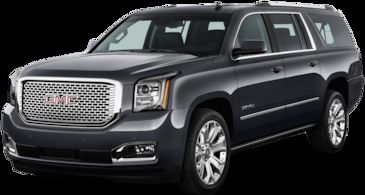
How many Yukon XL did GMC sell in Q1 2018?
GMC sold 6,108 Yukon XL in Q1 2018.
Overview
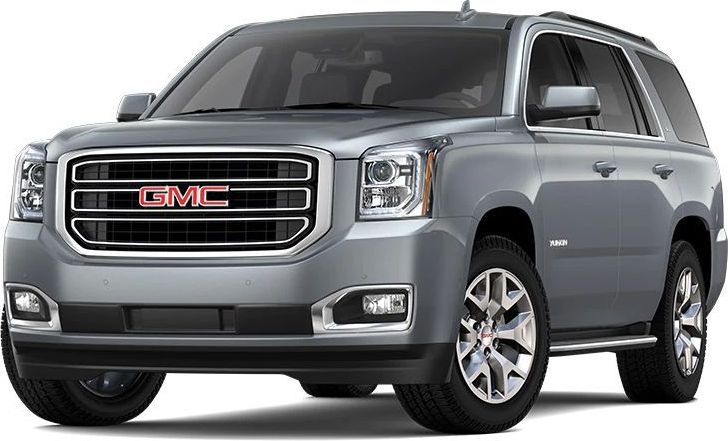
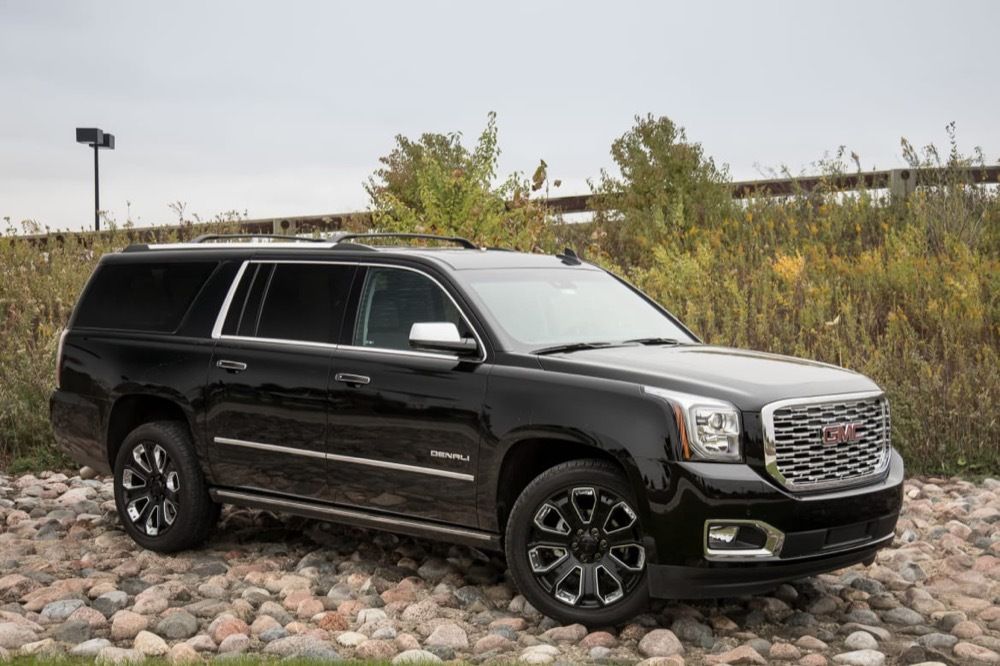
The GMC Yukon is a SUV with room for 8 people.
How Much Does the 2020 GMC Yukon Cost?
The 2020 GMC Yukon starts at $50,600 MSRP. Fully loaded, the GMC Yukon will cost you about $70,700.
GMC Yukon Engine, Transmission, and Performance Numbers
GMC Yukon includes a 5.3-liter V-8 engine combined with a 6-speed automatic. This delivers 355 hp with 383 lbs.-ft. Torque delivered through a RWD drivetrain.
2020 GMC Yukon Fuel Economy
The 2020 GMC Yukon can hold 26 gallons of fuel.
2020 GMC Yukon Specifications
The has a curb weight of 5,379 lbs.
List of GMC Yukon Competitors
Some of GMC Yukon competitors include the Ford Expedition, Toyota Land Cruiser and Chevrolet Suburban.
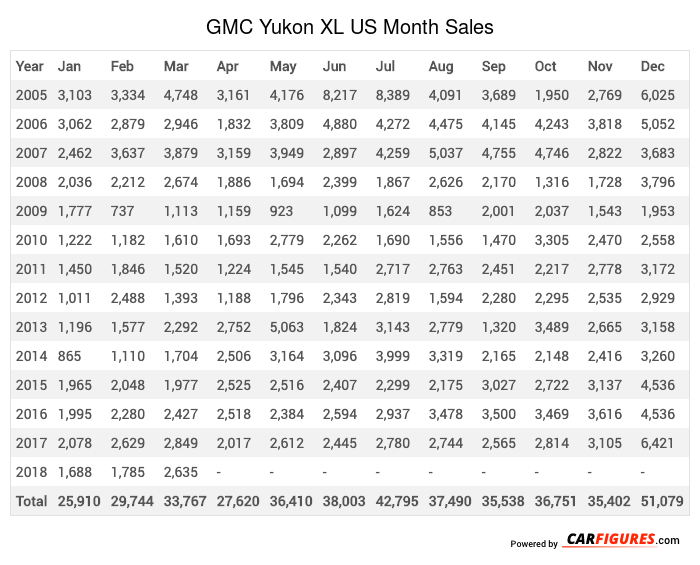
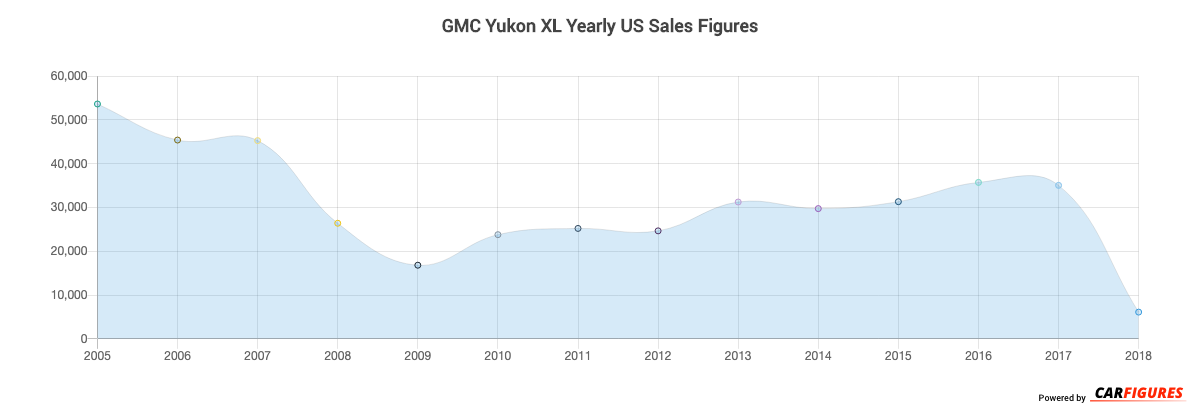
GMC Yukon XL United States Sale figures by year, quarter, and month are presented below. Including the most up to date sales data for the GMC Yukon XL. See how the GMC Yukon XL stacks up the other models in the Crossover/SUVS, Large SUVs segments.
| Year | Jan | Feb | Mar | Apr | May | Jun | Jul | Aug | Sep | Oct | Nov | Dec |
|---|---|---|---|---|---|---|---|---|---|---|---|---|
| 2005 | 3103 | 3334 | 4748 | 3161 | 4176 | 8217 | 8389 | 4091 | 3689 | 1950 | 2769 | 6025 |
| 2006 | 3062 | 2879 | 2946 | 1832 | 3809 | 4880 | 4272 | 4475 | 4145 | 4243 | 3818 | 5052 |
| 2007 | 2462 | 3637 | 3879 | 3159 | 3949 | 2897 | 4259 | 5037 | 4755 | 4746 | 2822 | 3683 |
| 2008 | 2036 | 2212 | 2674 | 1886 | 1694 | 2399 | 1867 | 2626 | 2170 | 1316 | 1728 | 3796 |
| 2009 | 1777 | 737 | 1113 | 1159 | 923 | 1099 | 1624 | 853 | 2001 | 2037 | 1543 | 1953 |
| 2010 | 1222 | 1182 | 1610 | 1693 | 2779 | 2262 | 1690 | 1556 | 1470 | 3305 | 2470 | 2558 |
| 2011 | 1450 | 1846 | 1520 | 1224 | 1545 | 1540 | 2717 | 2763 | 2451 | 2217 | 2778 | 3172 |
| 2012 | 1011 | 2488 | 1393 | 1188 | 1796 | 2343 | 2819 | 1594 | 2280 | 2295 | 2535 | 2929 |
| 2013 | 1196 | 1577 | 2292 | 2752 | 5063 | 1824 | 3143 | 2779 | 1320 | 3489 | 2665 | 3158 |
| 2014 | 865 | 1110 | 1704 | 2506 | 3164 | 3096 | 3999 | 3319 | 2165 | 2148 | 2416 | 3260 |
| 2015 | 1965 | 2048 | 1977 | 2525 | 2516 | 2407 | 2299 | 2175 | 3027 | 2722 | 3137 | 4536 |
| 2016 | 1995 | 2280 | 2427 | 2518 | 2384 | 2594 | 2937 | 3478 | 3500 | 3469 | 3616 | 4536 |
| 2017 | 2078 | 2629 | 2849 | 2017 | 2612 | 2445 | 2780 | 2744 | 2565 | 2814 | 3105 | 6421 |
| 2018 | 1688 | 1785 | 2635 | - | - | - | - | - | - | - | - | - |
| Total | 25910 | 29744 | 33767 | 27620 | 36410 | 38003 | 42795 | 37490 | 35538 | 36751 | 35402 | 51079 |
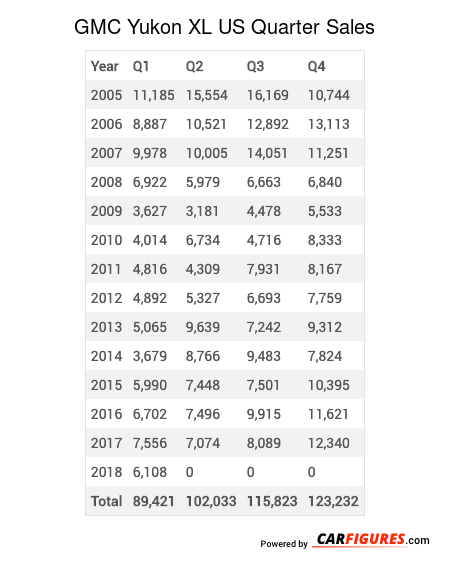
| Year | Q1 | Q2 | Q3 | Q4 |
|---|---|---|---|---|
| 2005 | 11185 | 15554 | 16169 | 10744 |
| 2006 | 8887 | 10521 | 12892 | 13113 |
| 2007 | 9978 | 10005 | 14051 | 11251 |
| 2008 | 6922 | 5979 | 6663 | 6840 |
| 2009 | 3627 | 3181 | 4478 | 5533 |
| 2010 | 4014 | 6734 | 4716 | 8333 |
| 2011 | 4816 | 4309 | 7931 | 8167 |
| 2012 | 4892 | 5327 | 6693 | 7759 |
| 2013 | 5065 | 9639 | 7242 | 9312 |
| 2014 | 3679 | 8766 | 9483 | 7824 |
| 2015 | 5990 | 7448 | 7501 | 10395 |
| 2016 | 6702 | 7496 | 9915 | 11621 |
| 2017 | 7556 | 7074 | 8089 | 12340 |
| 2018 | 6108 | 0 | 0 | 0 |
| Total | 89421 | 102033 | 115823 | 123232 |
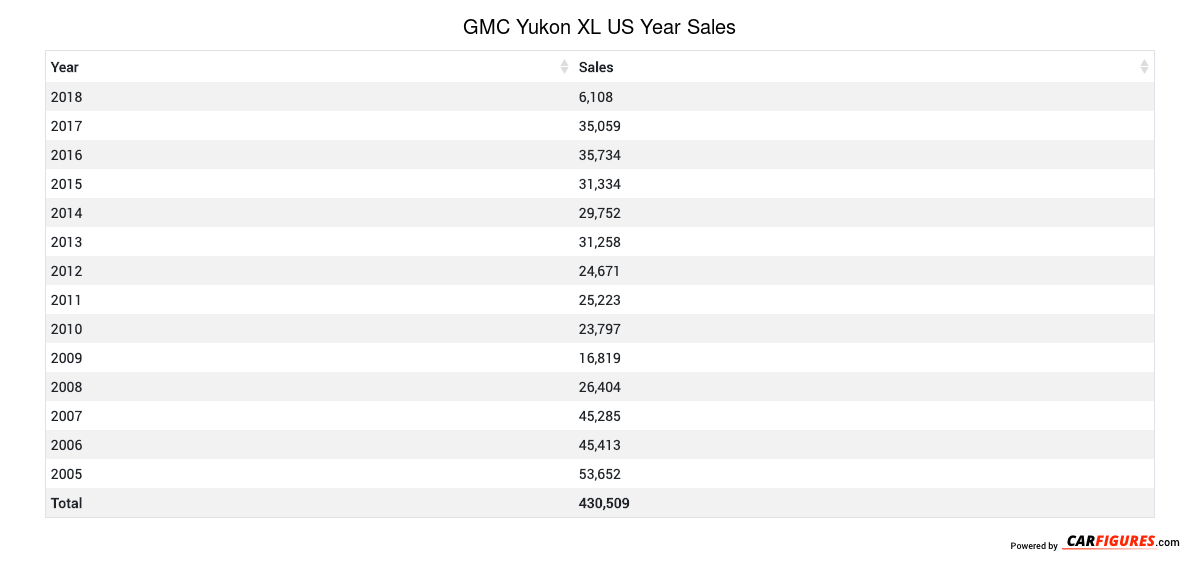
| Year | Sales |
|---|---|
| 2018 | 6108 |
| 2017 | 35059 |
| 2016 | 35734 |
| 2015 | 31334 |
| 2014 | 29752 |
| 2013 | 31258 |
| 2012 | 24671 |
| 2011 | 25223 |
| 2010 | 23797 |
| 2009 | 16819 |
| 2008 | 26404 |
| 2007 | 45285 |
| 2006 | 45413 |
| 2005 | 53652 |
| Total | 430509 |
Download Historic Sales Data

Embedded Code
See more widgetsSources: Manufacturers