Key Stats
How many Elantra did Hyundai sell in 2024?
Hyundai sold 26,860 Elantra in 2024. (From Jan - Mar 2024)
How many Elantra did Hyundai sell in March 2024?
Hyundai sold 11,528 Elantra in March 2024.
How many Elantra did Hyundai sell in 2023?
Hyundai sold 134,149 Elantra in 2023. In 2022, Hyundai sold 117,177 Elantra. They sold 16,972 more units in 2023 compared to 2022 with a percent gain of 14.48% YoY.
Overview
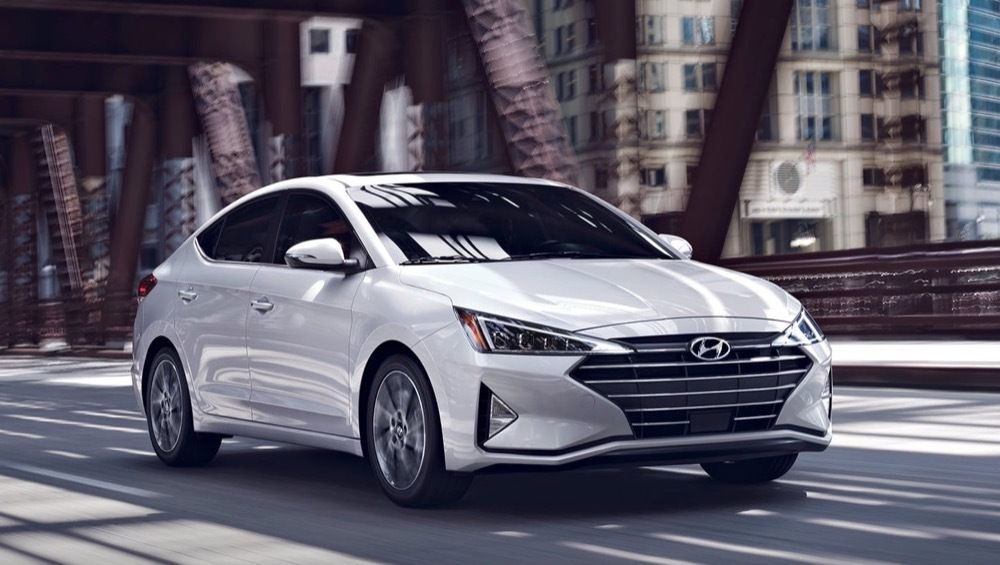
The 2022 Hyundai Elantra is a vehicle from automaker Hyundai.
How Much Does the 2022 Hyundai Elantra Cost?
The 2022 Hyundai Elantra starts at $19,850 MSRP. Fully loaded, the Hyundai Elantra will cost you about $25,600.
Hyundai Elantra Engine, Transmission, and Performance Numbers
The Hyundai Elantra includes a 2.0-liter coupled with a Intelligent Variable (IVT) that delivers 147 hp and 132 lb-ft torque with a Front Wheel Drive drivetrain.
List of Hyundai Elantra Competitors
Some of Hyundai Elantra competitors include the Mazda 3, Honda Civic and Kia Forte.
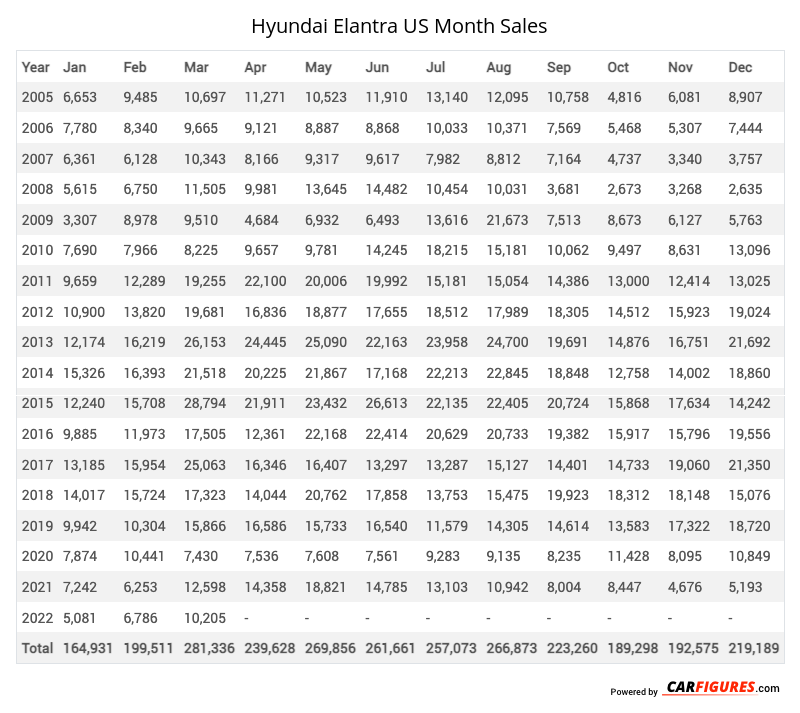
Hyundai Elantra United States Sale figures by year, quarter, and month are presented below. Including the most up to date sales data for the Hyundai Elantra. See how the Hyundai Elantra stacks up the other models in the Cars, Compact Cars segments.
| Year | Jan | Feb | Mar | Apr | May | Jun | Jul | Aug | Sep | Oct | Nov | Dec |
|---|---|---|---|---|---|---|---|---|---|---|---|---|
| 2005 | 6653 | 9485 | 10697 | 11271 | 10523 | 11910 | 13140 | 12095 | 10758 | 4816 | 6081 | 8907 |
| 2006 | 7780 | 8340 | 9665 | 9121 | 8887 | 8868 | 10033 | 10371 | 7569 | 5468 | 5307 | 7444 |
| 2007 | 6361 | 6128 | 10343 | 8166 | 9317 | 9617 | 7982 | 8812 | 7164 | 4737 | 3340 | 3757 |
| 2008 | 5615 | 6750 | 11505 | 9981 | 13645 | 14482 | 10454 | 10031 | 3681 | 2673 | 3268 | 2635 |
| 2009 | 3307 | 8978 | 9510 | 4684 | 6932 | 6493 | 13616 | 21673 | 7513 | 8673 | 6127 | 5763 |
| 2010 | 7690 | 7966 | 8225 | 9657 | 9781 | 14245 | 18215 | 15181 | 10062 | 9497 | 8631 | 13096 |
| 2011 | 9659 | 12289 | 19255 | 22100 | 20006 | 19992 | 15181 | 15054 | 14386 | 13000 | 12414 | 13025 |
| 2012 | 10900 | 13820 | 19681 | 16836 | 18877 | 17655 | 18512 | 17989 | 18305 | 14512 | 15923 | 19024 |
| 2013 | 12174 | 16219 | 26153 | 24445 | 25090 | 22163 | 23958 | 24700 | 19691 | 14876 | 16751 | 21692 |
| 2014 | 15326 | 16393 | 21518 | 20225 | 21867 | 17168 | 22213 | 22845 | 18848 | 12758 | 14002 | 18860 |
| 2015 | 12240 | 15708 | 28794 | 21911 | 23432 | 26613 | 22135 | 22405 | 20724 | 15868 | 17634 | 14242 |
| 2016 | 9885 | 11973 | 17505 | 12361 | 22168 | 22414 | 20629 | 20733 | 19382 | 15917 | 15796 | 19556 |
| 2017 | 13185 | 15954 | 25063 | 16346 | 16407 | 13297 | 13287 | 15127 | 14401 | 14733 | 19060 | 21350 |
| 2018 | 14017 | 15724 | 17323 | 14044 | 20762 | 17858 | 13753 | 15475 | 19923 | 18312 | 18148 | 15076 |
| 2019 | 9942 | 10304 | 15866 | 16586 | 15733 | 16540 | 11579 | 14305 | 14614 | 13583 | 17322 | 18720 |
| 2020 | 7874 | 10441 | 7430 | 7536 | 7608 | 7561 | 9283 | 9135 | 8235 | 11428 | 8095 | 10849 |
| 2021 | 7242 | 6253 | 12598 | 14358 | 18821 | 14785 | 13103 | 10942 | 8004 | 8447 | 4676 | 5193 |
| 2022 | 5081 | 6786 | 10205 | 10669 | 7731 | 8372 | 12021 | 14238 | 10761 | 8530 | 11040 | 11743 |
| 2023 | 8655 | 10371 | 13447 | 13236 | 15605 | 13424 | 11898 | 11262 | 9405 | 9456 | 8813 | 8577 |
| 2024 | 6900 | 8432 | 11528 | - | - | - | - | - | - | - | - | - |
| Total | 180486 | 218314 | 306311 | 263533 | 293192 | 283457 | 280992 | 292373 | 243426 | 207284 | 212428 | 239509 |
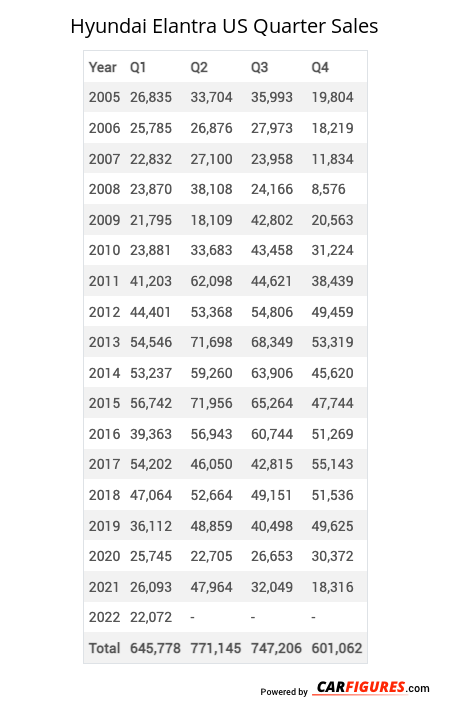
| Year | Q1 | Q2 | Q3 | Q4 |
|---|---|---|---|---|
| 2005 | 26835 | 33704 | 35993 | 19804 |
| 2006 | 25785 | 26876 | 27973 | 18219 |
| 2007 | 22832 | 27100 | 23958 | 11834 |
| 2008 | 23870 | 38108 | 24166 | 8576 |
| 2009 | 21795 | 18109 | 42802 | 20563 |
| 2010 | 23881 | 33683 | 43458 | 31224 |
| 2011 | 41203 | 62098 | 44621 | 38439 |
| 2012 | 44401 | 53368 | 54806 | 49459 |
| 2013 | 54546 | 71698 | 68349 | 53319 |
| 2014 | 53237 | 59260 | 63906 | 45620 |
| 2015 | 56742 | 71956 | 65264 | 47744 |
| 2016 | 39363 | 56943 | 60744 | 51269 |
| 2017 | 54202 | 46050 | 42815 | 55143 |
| 2018 | 47064 | 52664 | 49151 | 51536 |
| 2019 | 36112 | 48859 | 40498 | 49625 |
| 2020 | 25745 | 22705 | 26653 | 30372 |
| 2021 | 26093 | 47964 | 32049 | 18316 |
| 2022 | 22072 | 26772 | 37020 | 31313 |
| 2023 | 32473 | 42265 | 32565 | 26846 |
| 2024 | 26860 | - | - | - |
| Total | 705111 | 840182 | 816791 | 659221 |
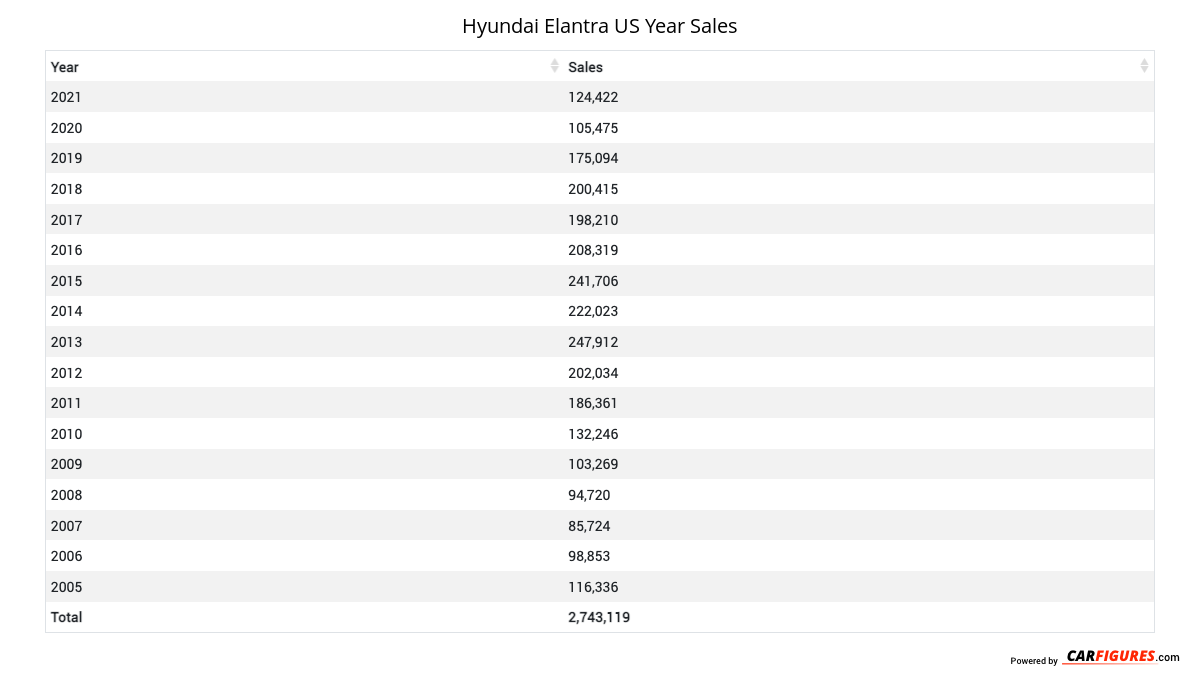
| Year | Sales |
|---|---|
| 2023 | 134149 |
| 2022 | 117177 |
| 2021 | 124422 |
| 2020 | 105475 |
| 2019 | 175094 |
| 2018 | 200415 |
| 2017 | 198210 |
| 2016 | 208319 |
| 2015 | 241706 |
| 2014 | 222023 |
| 2013 | 247912 |
| 2012 | 202034 |
| 2011 | 186361 |
| 2010 | 132246 |
| 2009 | 103269 |
| 2008 | 94720 |
| 2007 | 85724 |
| 2006 | 98853 |
| 2005 | 116336 |
| Total | 2994445 |
Download Historic Sales Data
Embedded Code
See more widgetsSources: Manufacturers