Key Stats
How many QX60 did Infiniti sell in 2024?
Infiniti sold 6,333 QX60 in 2024. (From Jan - Mar 2024)
How many QX60 did Infiniti sell in Q1 2024?
Infiniti sold 6,333 QX60 in Q1 2024.
How many QX60 did Infiniti sell in 2023?
Infiniti sold 21,827 QX60 in 2023. In 2022, Infiniti sold 16,574 QX60. They sold 5,253 more units in 2023 compared to 2022 with a percent gain of 31.69% YoY.
Overview
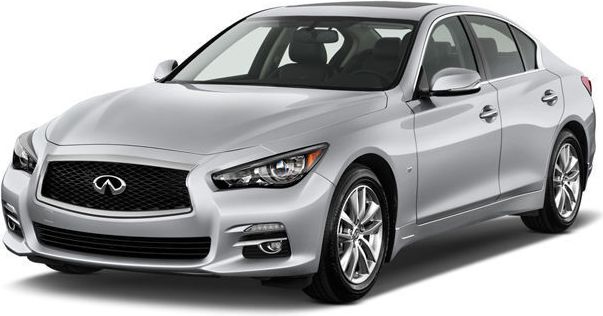
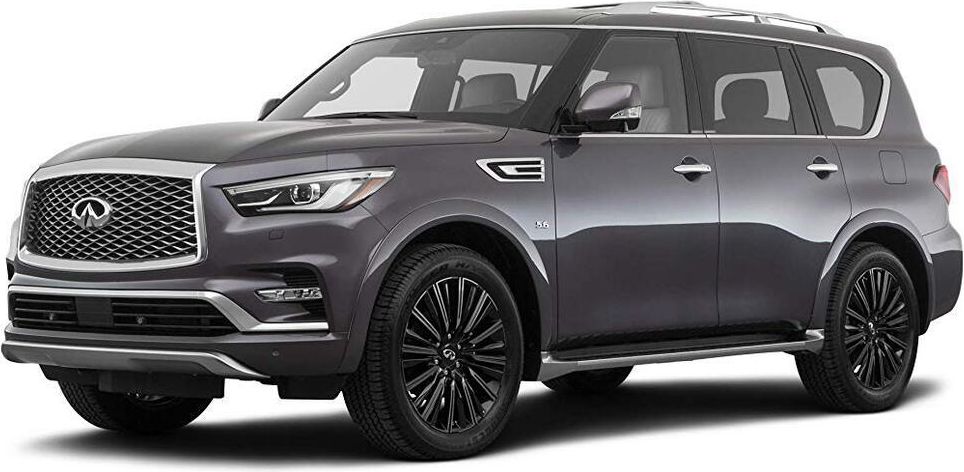
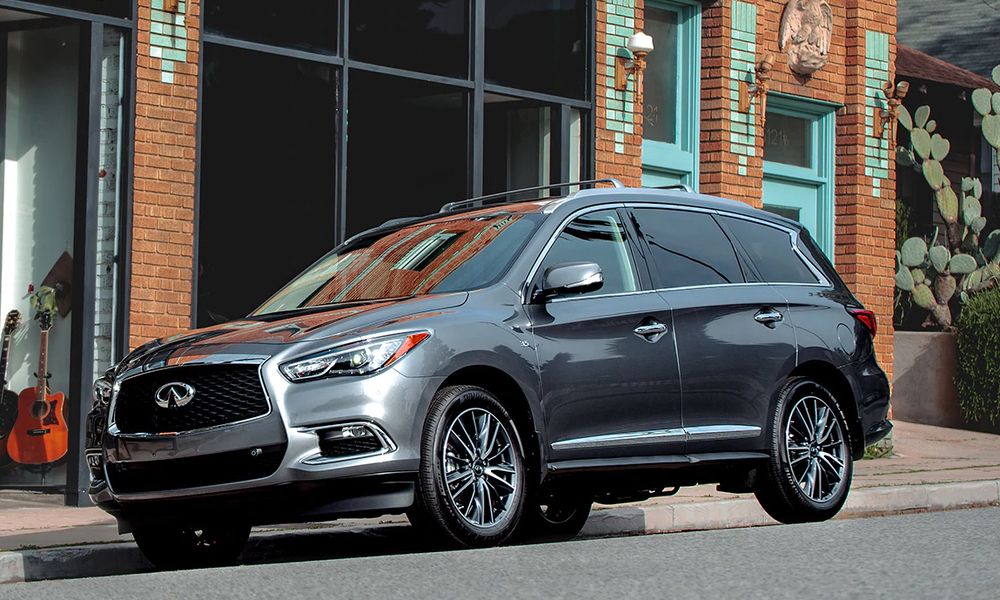
The 2022 INFINITI QX60 is a vehicle from automaker Infiniti.
How Much Does the 2022 INFINITI QX60 Cost?
The 2022 INFINITI QX60 starts at $46,850 MSRP. Fully loaded, the INFINITI QX60 will cost you about $63,250.
INFINITI QX60 Engine, Transmission, and Performance Numbers
INFINITI QX60 is powered by a 3.5-liter engine with a Front Wheel Drive powertrain that makes 295 -hp and 270 lb-ft torque. The transmission on the INFINITI QX60 is an 9-Speed Automatic.
List of INFINITI QX60 Competitors
Some of INFINITI QX60 competitors include the Acura MDX, Audi Q7 and Nissan Pathfinder.
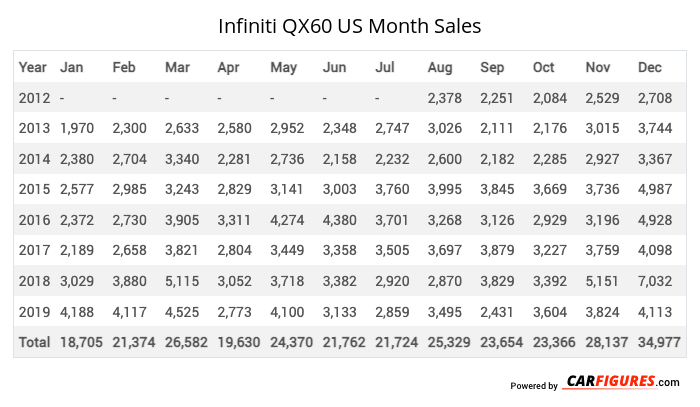
Infiniti QX60 United States Sale figures by year, quarter, and month are presented below. Including the most up to date sales data for the Infiniti QX60. See how the Infiniti QX60 stacks up the other models in the Crossover/SUVS, Premium Midsize Crossover/SUVs segments.
| Year | Jan | Feb | Mar | Apr | May | Jun | Jul | Aug | Sep | Oct | Nov | Dec |
|---|---|---|---|---|---|---|---|---|---|---|---|---|
| 2012 | - | - | - | - | - | - | - | 2378 | 2251 | 2084 | 2529 | 2708 |
| 2013 | 1970 | 2300 | 2633 | 2580 | 2952 | 2348 | 2747 | 3026 | 2111 | 2176 | 3015 | 3744 |
| 2014 | 2380 | 2704 | 3340 | 2281 | 2736 | 2158 | 2232 | 2600 | 2182 | 2285 | 2927 | 3367 |
| 2015 | 2577 | 2985 | 3243 | 2829 | 3141 | 3003 | 3760 | 3995 | 3845 | 3669 | 3736 | 4987 |
| 2016 | 2372 | 2730 | 3905 | 3311 | 4274 | 4380 | 3701 | 3268 | 3126 | 2929 | 3196 | 4928 |
| 2017 | 2189 | 2658 | 3821 | 2804 | 3449 | 3358 | 3505 | 3697 | 3879 | 3227 | 3759 | 4098 |
| 2018 | 3029 | 3880 | 5115 | 3052 | 3718 | 3382 | 2920 | 2870 | 3829 | 3392 | 5151 | 7032 |
| 2019 | 4188 | 4117 | 4525 | 2773 | 4100 | 3133 | 2859 | 3495 | 2431 | 3604 | 3824 | 4113 |
| Total | 18705 | 21374 | 26582 | 19630 | 24370 | 21762 | 21724 | 25329 | 23654 | 23366 | 28137 | 34977 |
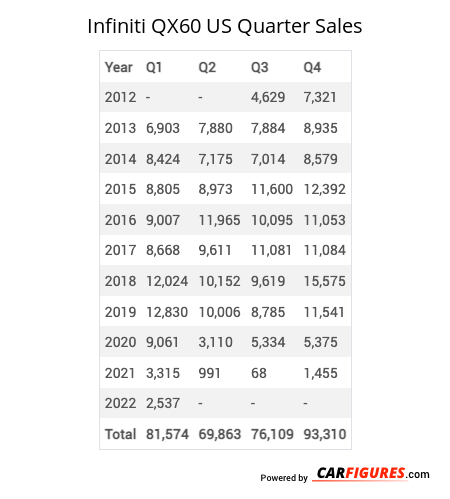
| Year | Q1 | Q2 | Q3 | Q4 |
|---|---|---|---|---|
| 2012 | - | - | 4629 | 7321 |
| 2013 | 6903 | 7880 | 7884 | 8935 |
| 2014 | 8424 | 7175 | 7014 | 8579 |
| 2015 | 8805 | 8973 | 11600 | 12392 |
| 2016 | 9007 | 11965 | 10095 | 11053 |
| 2017 | 8668 | 9611 | 11081 | 11084 |
| 2018 | 12024 | 10152 | 9619 | 15575 |
| 2019 | 12830 | 10006 | 8785 | 11541 |
| 2020 | 9061 | 3110 | 5334 | 5375 |
| 2021 | 3315 | 991 | 68 | 1455 |
| 2022 | 2537 | 3245 | 4549 | 6243 |
| 2023 | 7138 | 7730 | 0 | 6959 |
| 2024 | 6333 | - | - | - |
| Total | 95045 | 80838 | 80658 | 106512 |
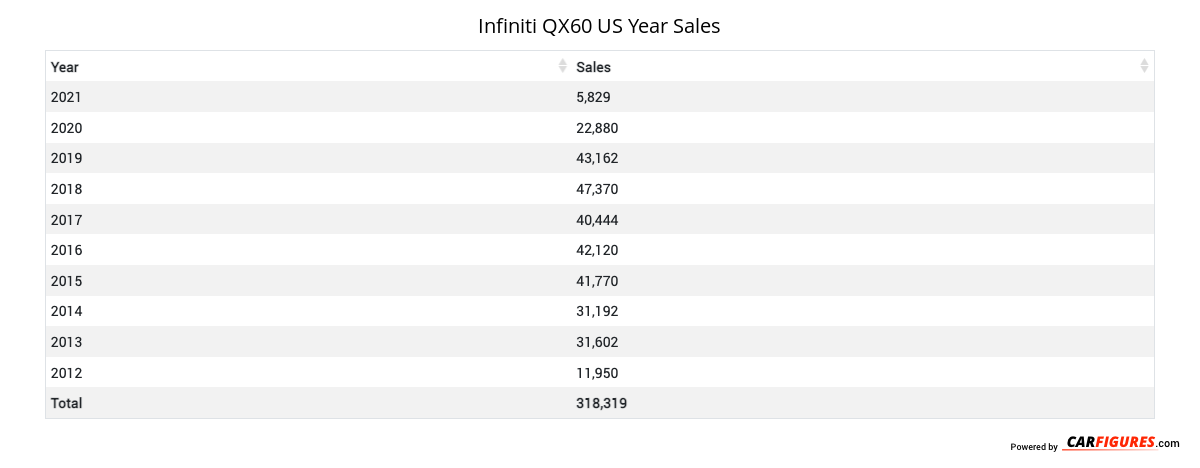
| Year | Sales |
|---|---|
| 2023 | 21827 |
| 2022 | 16574 |
| 2021 | 5829 |
| 2020 | 22880 |
| 2019 | 43162 |
| 2018 | 47370 |
| 2017 | 40444 |
| 2016 | 42120 |
| 2015 | 41770 |
| 2014 | 31192 |
| 2013 | 31602 |
| 2012 | 11950 |
| Total | 356720 |
Download Historic Sales Data
Embedded Code
See more widgetsSources: Manufacturers