Key Stats
How many GT-R did Nissan sell in 2024?
Nissan sold 76 GT-R in 2024. (From Jan - Mar 2024)
How many GT-R did Nissan sell in Q1 2024?
Nissan sold 76 GT-R in Q1 2024.
How many GT-R did Nissan sell in 2023?
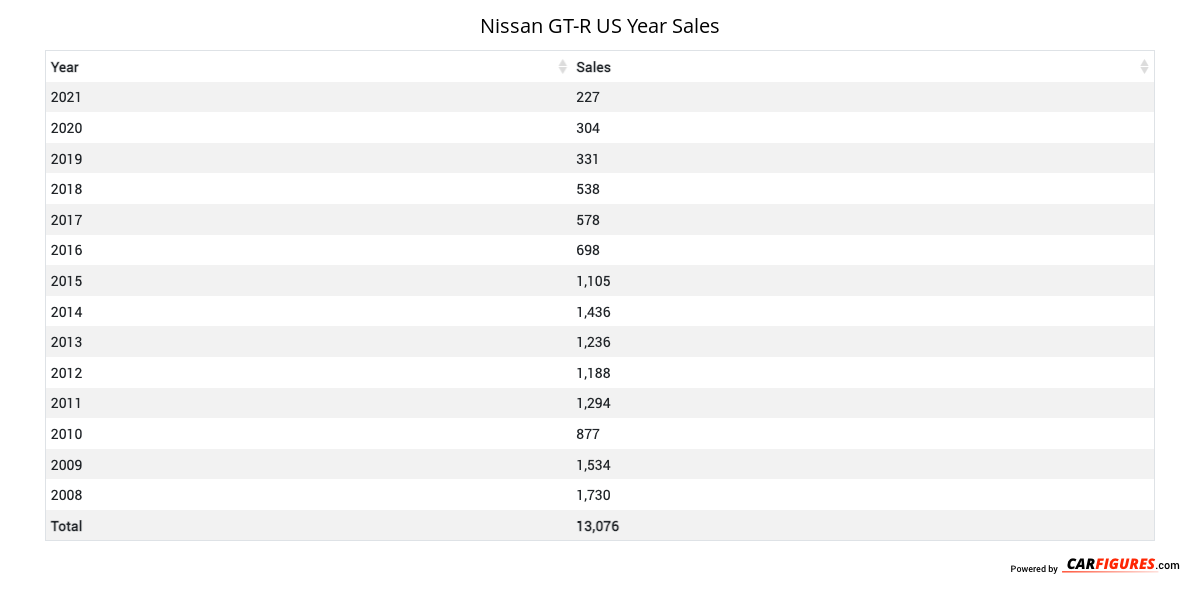
Nissan sold 326 GT-R in 2023. In 2022, Nissan sold 57 GT-R. They sold 269 more units in 2023 compared to 2022 with a percent gain of 471.93% YoY.
Overview
The 2024 Nissan GT-R is a vehicle from automaker Nissan.
How Much Does the 2024 Nissan GT-R Cost?
Pricing for the 2024 Nissan GT-R starts at $120,990 MSRP and goes up to $220,990 fully loaded.
Nissan GT-R Engine, Transmission, and Performance Numbers
Nissan GT-R is powered by a 3.8-liter engine with a All Wheel Drive powertrain that makes 565 -hp and 467 lb-ft torque. The transmission on the Nissan GT-R is an Dual-Clutch 6-Speed.
List of Nissan GT-R Competitors
Some of Nissan GT-R competitors include the Audi R8, Porsche 911 and Chevrolet Corvette.
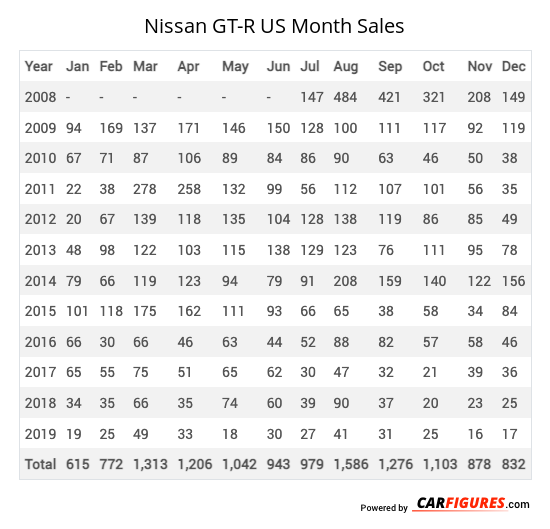
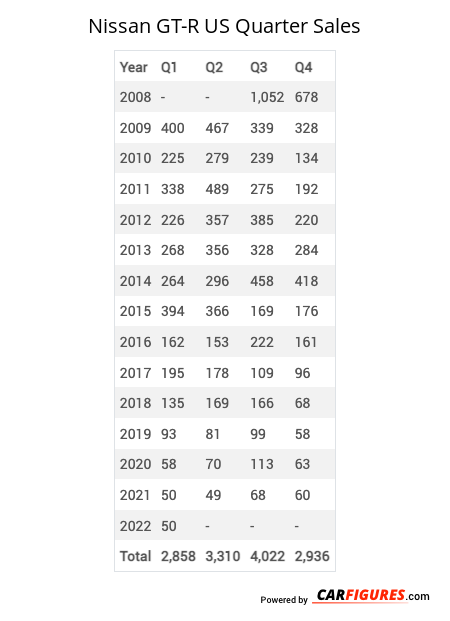
Nissan GT-R United States Sale figures by year, quarter, and month are presented below. Including the most up to date sales data for the Nissan GT-R. See how the Nissan GT-R stacks up the other models in the Cars, Exotic Vehicles, Premium Sport/Performance Cars segments.
| Year | Jan | Feb | Mar | Apr | May | Jun | Jul | Aug | Sep | Oct | Nov | Dec |
|---|---|---|---|---|---|---|---|---|---|---|---|---|
| 2008 | - | - | - | - | - | - | 147 | 484 | 421 | 321 | 208 | 149 |
| 2009 | 94 | 169 | 137 | 171 | 146 | 150 | 128 | 100 | 111 | 117 | 92 | 119 |
| 2010 | 67 | 71 | 87 | 106 | 89 | 84 | 86 | 90 | 63 | 46 | 50 | 38 |
| 2011 | 22 | 38 | 278 | 258 | 132 | 99 | 56 | 112 | 107 | 101 | 56 | 35 |
| 2012 | 20 | 67 | 139 | 118 | 135 | 104 | 128 | 138 | 119 | 86 | 85 | 49 |
| 2013 | 48 | 98 | 122 | 103 | 115 | 138 | 129 | 123 | 76 | 111 | 95 | 78 |
| 2014 | 79 | 66 | 119 | 123 | 94 | 79 | 91 | 208 | 159 | 140 | 122 | 156 |
| 2015 | 101 | 118 | 175 | 162 | 111 | 93 | 66 | 65 | 38 | 58 | 34 | 84 |
| 2016 | 66 | 30 | 66 | 46 | 63 | 44 | 52 | 88 | 82 | 57 | 58 | 46 |
| 2017 | 65 | 55 | 75 | 51 | 65 | 62 | 30 | 47 | 32 | 21 | 39 | 36 |
| 2018 | 34 | 35 | 66 | 35 | 74 | 60 | 39 | 90 | 37 | 20 | 23 | 25 |
| 2019 | 19 | 25 | 49 | 33 | 18 | 30 | 27 | 41 | 31 | 25 | 16 | 17 |
| Total | 615 | 772 | 1313 | 1206 | 1042 | 943 | 979 | 1586 | 1276 | 1103 | 878 | 832 |
| Year | Q1 | Q2 | Q3 | Q4 |
|---|---|---|---|---|
| 2008 | - | - | 1052 | 678 |
| 2009 | 400 | 467 | 339 | 328 |
| 2010 | 225 | 279 | 239 | 134 |
| 2011 | 338 | 489 | 275 | 192 |
| 2012 | 226 | 357 | 385 | 220 |
| 2013 | 268 | 356 | 328 | 284 |
| 2014 | 264 | 296 | 458 | 418 |
| 2015 | 394 | 366 | 169 | 176 |
| 2016 | 162 | 153 | 222 | 161 |
| 2017 | 195 | 178 | 109 | 96 |
| 2018 | 135 | 169 | 166 | 68 |
| 2019 | 93 | 81 | 99 | 58 |
| 2020 | 58 | 70 | 113 | 63 |
| 2021 | 50 | 49 | 68 | 60 |
| 2022 | 50 | 4 | 2 | 1 |
| 2023 | 143 | 74 | 30 | 79 |
| 2024 | 76 | - | - | - |
| Total | 3077 | 3388 | 4054 | 3016 |
| Year | Sales |
|---|---|
| 2023 | 326 |
| 2022 | 57 |
| 2021 | 227 |
| 2020 | 304 |
| 2019 | 331 |
| 2018 | 538 |
| 2017 | 578 |
| 2016 | 698 |
| 2015 | 1105 |
| 2014 | 1436 |
| 2013 | 1236 |
| 2012 | 1188 |
| 2011 | 1294 |
| 2010 | 877 |
| 2009 | 1534 |
| 2008 | 1730 |
| Total | 13459 |
Download Historic Sales Data
Looking for more data/visualizations? Send us an email at [email protected] for customized data aggregates and visualizations.Embedded Code
See more widgetsSources: Manufacturers


