

Overview
The 2024 Porsche 911 is a vehicle from automaker Porsche.
How Much Does the 2024 Porsche 911 Cost?
Pricing for the 2024 Porsche 911 starts at $114,400 MSRP and goes up to $243,200 fully loaded.
Porsche 911 Engine, Transmission, and Performance Numbers
Porsche 911 is powered by a 3.0-liter engine with a Rear Wheel Drive powertrain that makes 379 -hp and 331 lb-ft torque. The transmission on the Porsche 911 is an 8-Speed Porsche Doppelkupplung (PDK).
List of Porsche 911 Competitors
Some of Porsche 911 competitors include the Chevrolet Corvette and Jaguar F-Type.
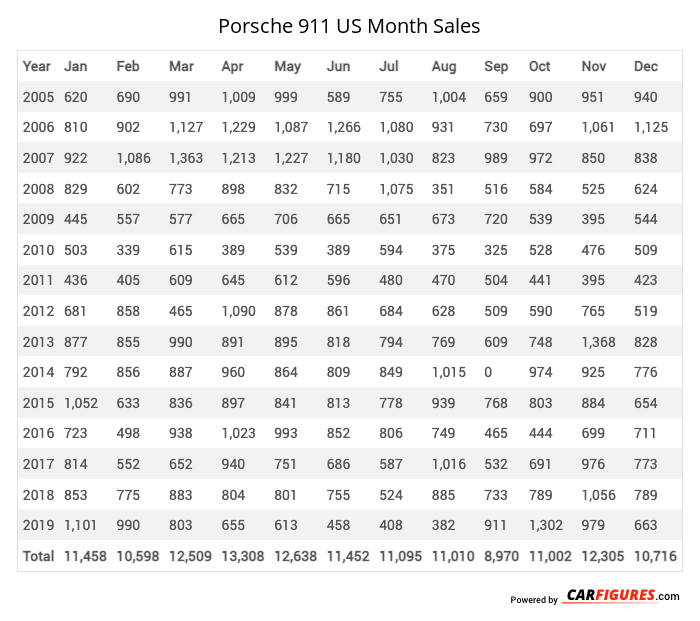
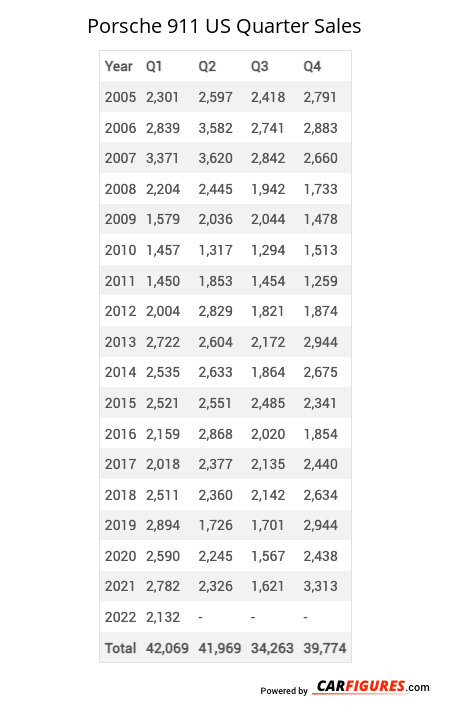
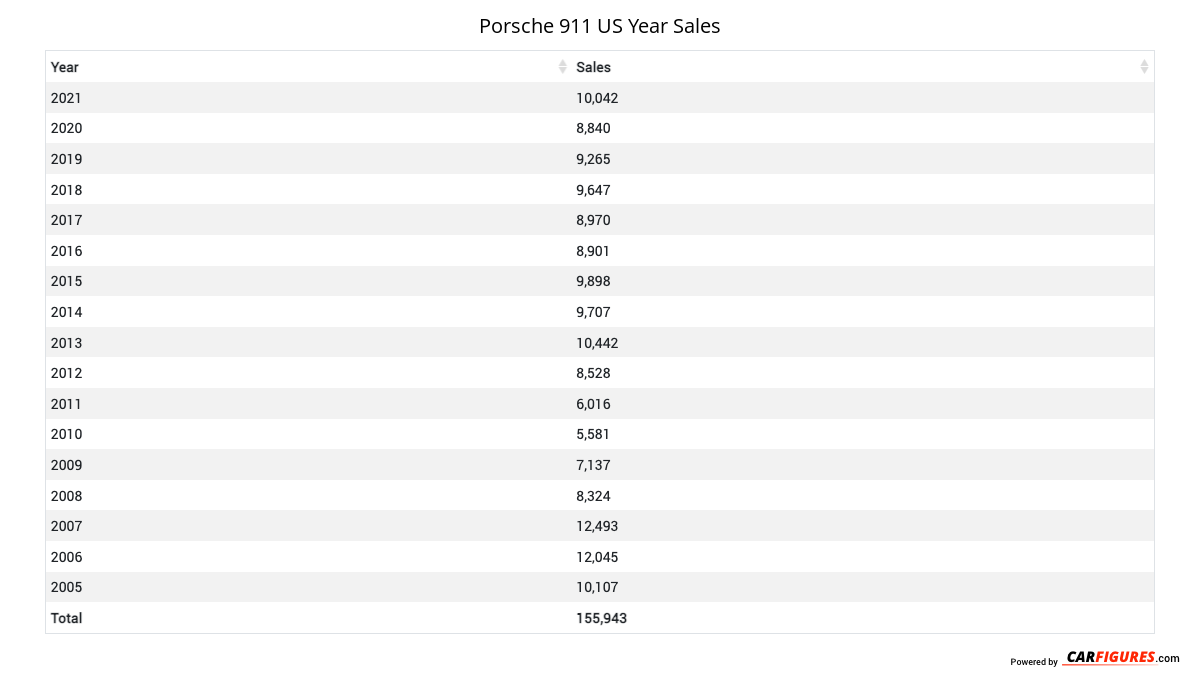
Porsche 911 United States Sale figures by year, quarter, and month are presented below. Including the most up to date sales data for the Porsche 911. See how the Porsche 911 stacks up the other models in the Cars, Premium Sport/Performance Cars segments.
For sales numbers of the Porsche 911 in Canada, click here.
| Year | Jan | Feb | Mar | Apr | May | Jun | Jul | Aug | Sep | Oct | Nov | Dec |
|---|---|---|---|---|---|---|---|---|---|---|---|---|
| 2005 | 620 | 690 | 991 | 1009 | 999 | 589 | 755 | 1004 | 659 | 900 | 951 | 940 |
| 2006 | 810 | 902 | 1127 | 1229 | 1087 | 1266 | 1080 | 931 | 730 | 697 | 1061 | 1125 |
| 2007 | 922 | 1086 | 1363 | 1213 | 1227 | 1180 | 1030 | 823 | 989 | 972 | 850 | 838 |
| 2008 | 829 | 602 | 773 | 898 | 832 | 715 | 1075 | 351 | 516 | 584 | 525 | 624 |
| 2009 | 445 | 557 | 577 | 665 | 706 | 665 | 651 | 673 | 720 | 539 | 395 | 544 |
| 2010 | 503 | 339 | 615 | 389 | 539 | 389 | 594 | 375 | 325 | 528 | 476 | 509 |
| 2011 | 436 | 405 | 609 | 645 | 612 | 596 | 480 | 470 | 504 | 441 | 395 | 423 |
| 2012 | 681 | 858 | 465 | 1090 | 878 | 861 | 684 | 628 | 509 | 590 | 765 | 519 |
| 2013 | 877 | 855 | 990 | 891 | 895 | 818 | 794 | 769 | 609 | 748 | 1368 | 828 |
| 2014 | 792 | 856 | 887 | 960 | 864 | 809 | 849 | 1015 | 0 | 974 | 925 | 776 |
| 2015 | 1052 | 633 | 836 | 897 | 841 | 813 | 778 | 939 | 768 | 803 | 884 | 654 |
| 2016 | 723 | 498 | 938 | 1023 | 993 | 852 | 806 | 749 | 465 | 444 | 699 | 711 |
| 2017 | 814 | 552 | 652 | 940 | 751 | 686 | 587 | 1016 | 532 | 691 | 976 | 773 |
| 2018 | 853 | 775 | 883 | 804 | 801 | 755 | 524 | 885 | 733 | 789 | 1056 | 789 |
| 2019 | 1101 | 990 | 803 | 655 | 613 | 458 | 408 | 382 | 911 | 1302 | 979 | 663 |
| Total | 11458 | 10598 | 12509 | 13308 | 12638 | 11452 | 11095 | 11010 | 8970 | 11002 | 12305 | 10716 |
| Year | Q1 | Q2 | Q3 | Q4 |
|---|---|---|---|---|
| 2005 | 2301 | 2597 | 2418 | 2791 |
| 2006 | 2839 | 3582 | 2741 | 2883 |
| 2007 | 3371 | 3620 | 2842 | 2660 |
| 2008 | 2204 | 2445 | 1942 | 1733 |
| 2009 | 1579 | 2036 | 2044 | 1478 |
| 2010 | 1457 | 1317 | 1294 | 1513 |
| 2011 | 1450 | 1853 | 1454 | 1259 |
| 2012 | 2004 | 2829 | 1821 | 1874 |
| 2013 | 2722 | 2604 | 2172 | 2944 |
| 2014 | 2535 | 2633 | 1864 | 2675 |
| 2015 | 2521 | 2551 | 2485 | 2341 |
| 2016 | 2159 | 2868 | 2020 | 1854 |
| 2017 | 2018 | 2377 | 2135 | 2440 |
| 2018 | 2511 | 2360 | 2142 | 2634 |
| 2019 | 2894 | 1726 | 1701 | 2944 |
| 2020 | 2590 | 2245 | 1567 | 2438 |
| 2021 | 2782 | 2326 | 1621 | 3313 |
| 2022 | 2132 | 3051 | 2236 | 0 |
| 2023 | 0 | 0 | 0 | 0 |
| 2024 | - | - | - | - |
| Total | 42069 | 45020 | 36499 | 39774 |
| Year | Sales |
|---|---|
| 2022 | 7419 |
| 2021 | 10042 |
| 2020 | 8840 |
| 2019 | 9265 |
| 2018 | 9647 |
| 2017 | 8970 |
| 2016 | 8901 |
| 2015 | 9898 |
| 2014 | 9707 |
| 2013 | 10442 |
| 2012 | 8528 |
| 2011 | 6016 |
| 2010 | 5581 |
| 2009 | 7137 |
| 2008 | 8324 |
| 2007 | 12493 |
| 2006 | 12045 |
| 2005 | 10107 |
| Total | 163362 |
Download Historic Sales Data
Embedded Code
See more widgetsSources: Manufacturers