Key Stats
How many Ascent did Subaru sell in 2024?
Subaru sold 12,683 Ascent in 2024. (From Jan - Mar 2024)
How many Ascent did Subaru sell in March 2024?
Subaru sold 5,174 Ascent in March 2024.
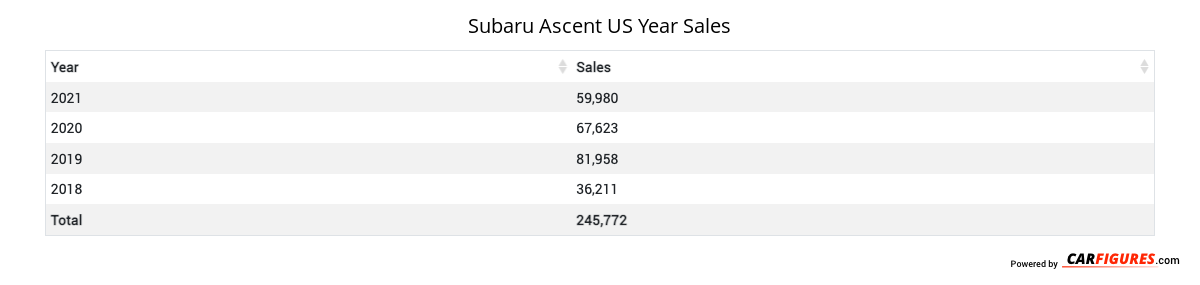
How many Ascent did Subaru sell in 2023?
Subaru sold 60,543 Ascent in 2023. In 2022, Subaru sold 63,704 Ascent. They sold 3,161 more units in year 2022 compared to 2023 with a percent loss of 4.96% YoY.
Overview
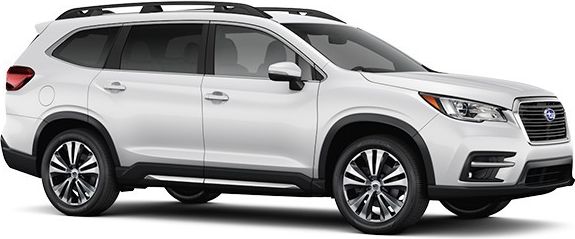
The 2024 Subaru Ascent is a vehicle from automaker Subaru.
How Much Does the 2024 Subaru Ascent Cost?
Pricing for the 2024 Subaru Ascent starts at $36,795 MSRP and goes up to $48,495 fully loaded.
Subaru Ascent Engine, Transmission, and Performance Numbers
Subaru Ascent is powered by a 2.4-liter engine with a All Wheel Drive powertrain that makes 260 -hp and 277 lb-ft torque. The transmission on the Subaru Ascent is an Lineartronic CVT.
List of Subaru Ascent Competitors
Some of Subaru Ascent competitors include the Honda Pilot, Mazda CX-9 and Chevrolet Traverse.
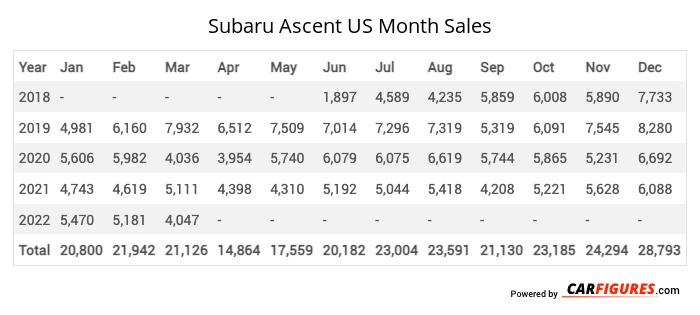
Subaru Ascent United States Sale figures by year, quarter, and month are presented below. Including the most up to date sales data for the Subaru Ascent. See how the Subaru Ascent stacks up the other models in the Crossover/SUVS, Midsize Crossover/SUVs segments.
| Year | Jan | Feb | Mar | Apr | May | Jun | Jul | Aug | Sep | Oct | Nov | Dec |
|---|---|---|---|---|---|---|---|---|---|---|---|---|
| 2018 | - | - | - | - | - | 1897 | 4589 | 4235 | 5859 | 6008 | 5890 | 7733 |
| 2019 | 4981 | 6160 | 7932 | 6512 | 7509 | 7014 | 7296 | 7319 | 5319 | 6091 | 7545 | 8280 |
| 2020 | 5606 | 5982 | 4036 | 3954 | 5740 | 6079 | 6075 | 6619 | 5744 | 5865 | 5231 | 6692 |
| 2021 | 4743 | 4619 | 5111 | 4398 | 4310 | 5192 | 5044 | 5418 | 4208 | 5221 | 5628 | 6088 |
| 2022 | 5470 | 5181 | 4047 | 5228 | 5402 | 5603 | 4489 | 5638 | 4964 | 5029 | 5673 | 6980 |
| 2023 | 4582 | 4406 | 5794 | 5965 | 6505 | 5889 | 4281 | 4860 | 4599 | 4374 | 4292 | 4996 |
| 2024 | 3718 | 3791 | 5174 | - | - | - | - | - | - | - | - | - |
| Total | 29100 | 30139 | 32094 | 26057 | 29466 | 31674 | 31774 | 34089 | 30693 | 32588 | 34259 | 40769 |
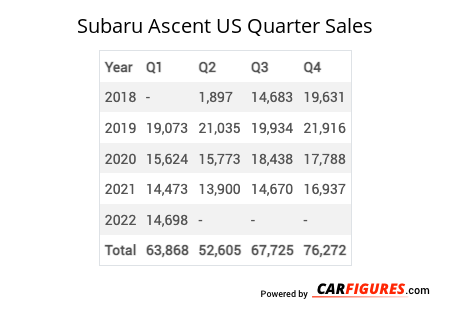
| Year | Q1 | Q2 | Q3 | Q4 |
|---|---|---|---|---|
| 2018 | - | 1897 | 14683 | 19631 |
| 2019 | 19073 | 21035 | 19934 | 21916 |
| 2020 | 15624 | 15773 | 18438 | 17788 |
| 2021 | 14473 | 13900 | 14670 | 16937 |
| 2022 | 14698 | 16233 | 15091 | 17682 |
| 2023 | 14782 | 18359 | 13740 | 13662 |
| 2024 | 12683 | - | - | - |
| Total | 91333 | 87197 | 96556 | 107616 |
| Year | Sales |
|---|---|
| 2023 | 60543 |
| 2022 | 63704 |
| 2021 | 59980 |
| 2020 | 67623 |
| 2019 | 81958 |
| 2018 | 36211 |
| Total | 370019 |
Download Historic Sales Data
Embedded Code
See more widgetsSources: Manufacturers