Last updated: April 03, 2024
Key Stats
How many cars did Toyota sell in 2023?
Toyota sold 1,794,476 vehicles in 2023. In 2022, Toyota sold 1,734,356 vehicles. They sold 60,120 more vehicles in 2023 compared to 2022 with a percent gain of 3.47% YoY.
Toyota Total US Sales Statistics by Year
Toyota Total US Sales Statistics by Quarter
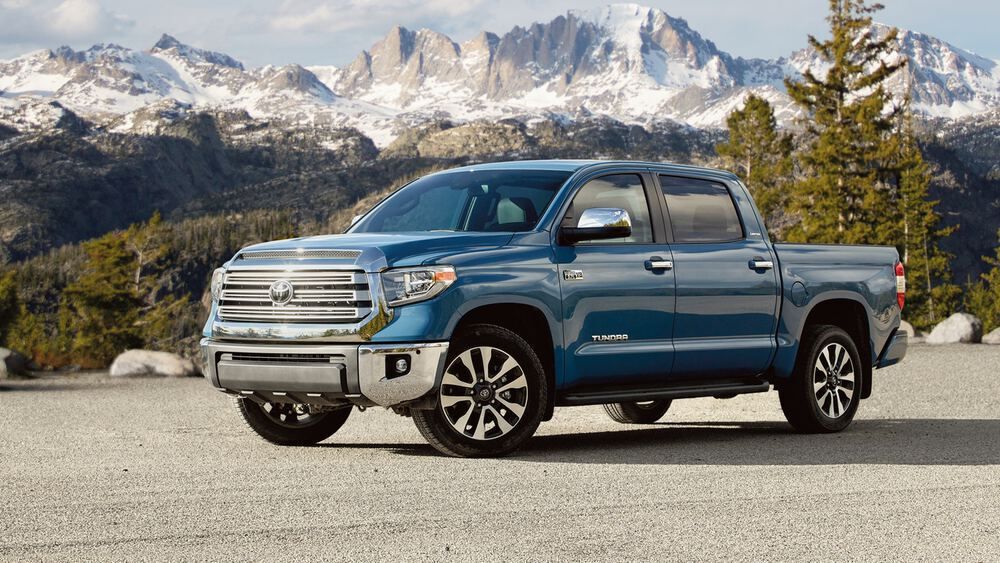
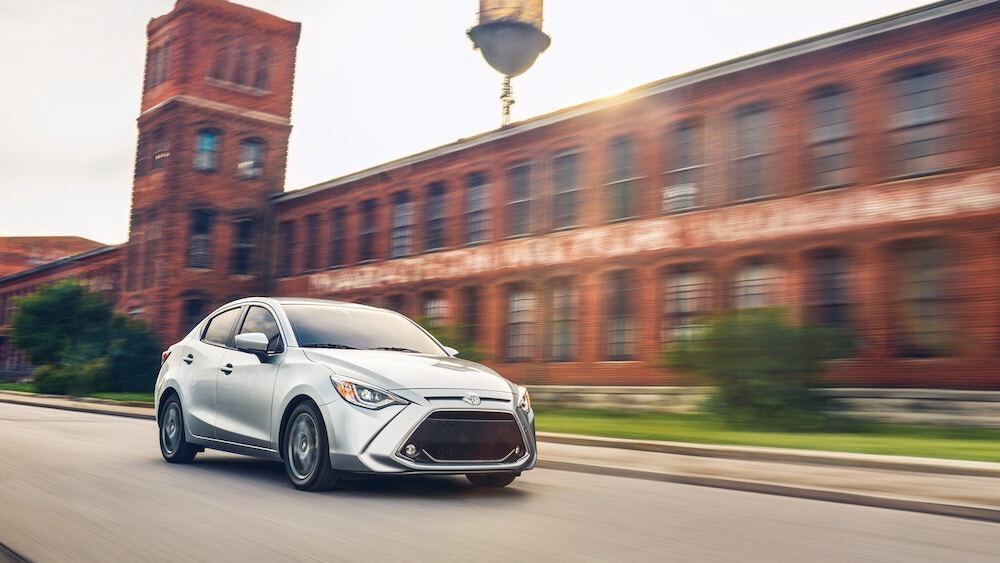
Current Lineup


Discontinued Models
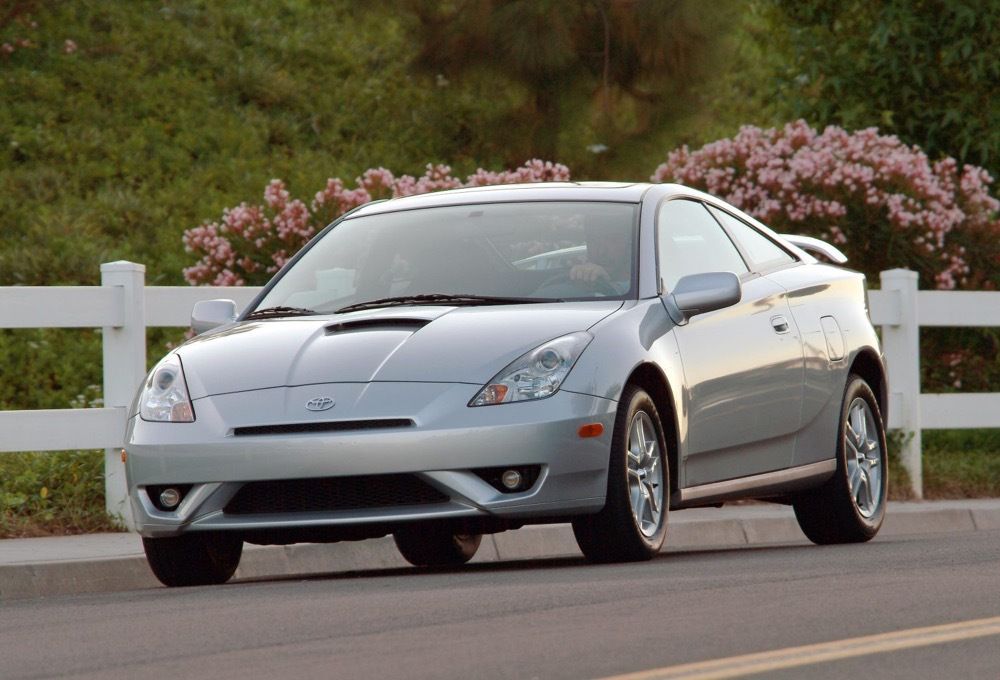
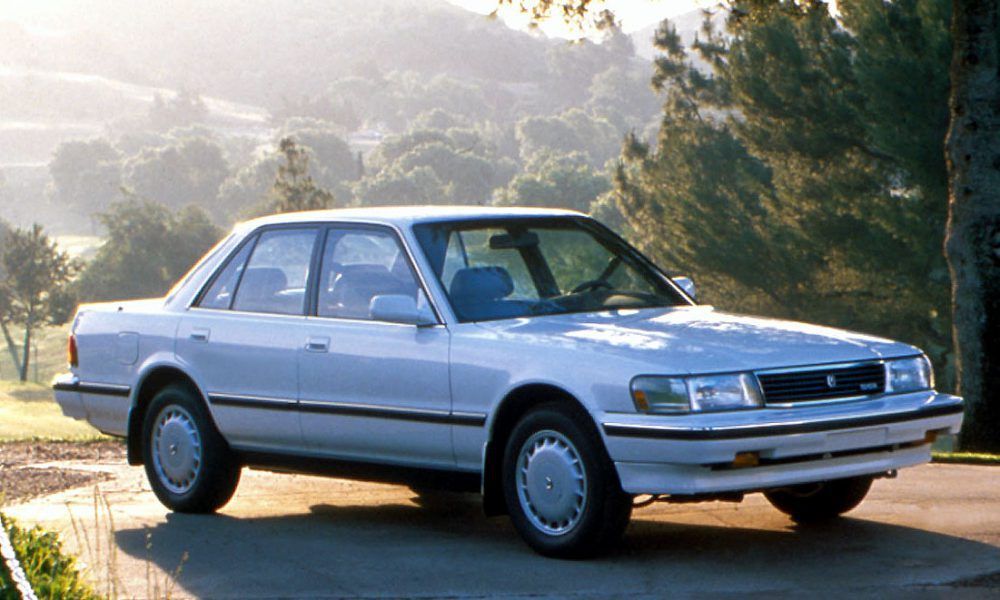

Toyota includes the cars 2024 4Runner, 2024 86 / FR-S, 2024 Avalon, 2024 Camry, 2005 Celica, 2024 C-HR, 2024 Corolla, 2024 Corolla Cross, 1992 Cressida, 2005 Echo, 2014 FJ Cruiser, 2022 GR86, 2024 Highlander, 2024 Land Cruiser, 2024 Mirai, 2005 MR2 Spyder, 2024 Prius Family, 2024 RAV4, 2024 Sequoia, 2024 Sienna, 2024 Supra, 2024 Tacoma, 1998 Tercel, 2024 Tundra, 2024 Venza, 2024 Yaris
Toyota Total US Quarter Sales Table
| Year | Q1 | Q2 | Q3 | Q4 |
|---|---|---|---|---|
| 2005 | 408135 | 484320 | 478085 | 424177 |
| 2006 | 440098 | 546936 | 567181 | 492806 |
| 2007 | 500424 | 606440 | 546466 | 504830 |
| 2008 | 474346 | 560154 | 453824 | 352343 |
| 2009 | 306317 | 359135 | 445463 | 396465 |
| 2010 | 326590 | 391515 | 397539 | 372944 |
| 2011 | 373809 | 324348 | 323092 | 375568 |
| 2012 | 423017 | 482596 | 445796 | 424841 |
| 2013 | 460967 | 504430 | 502699 | 444105 |
| 2014 | 444880 | 559064 | 535240 | 479251 |
| 2015 | 488907 | 564502 | 535890 | 522629 |
| 2016 | 478346 | 533953 | 528519 | 531486 |
| 2017 | 470624 | 550604 | 590392 | 517555 |
| 2018 | 507821 | 546487 | 556301 | 517746 |
| 2019 | 476925 | 539448 | 553378 | 515455 |
| 2020 | 439402 | 347573 | 483164 | 567761 |
| 2021 | 528813 | 605352 | 484912 | 408709 |
| 2022 | 450227 | 416602 | 411957 | 455570 |
| 2023 | 385492 | - | - | - |
Toyota Total US Year Sales Table
| Year | Sales |
|---|---|
| 2023 | 1794476 |
| 2022 | 1734356 |
| 2021 | 2027786 |
| 2020 | 1837900 |
| 2019 | 2085206 |
| 2018 | 2128355 |
| 2017 | 2129175 |
| 2016 | 2072304 |
| 2015 | 2111928 |
| 2014 | 2018435 |
| 2013 | 1912201 |
| 2012 | 1776250 |
| 2011 | 1396817 |
| 2010 | 1488588 |
| 2009 | 1507380 |
| 2008 | 1840667 |
| 2007 | 2158160 |
| 2006 | 2047021 |
| 2005 | 1794717 |
| Total | 35861722 |