
Key Stats
How many Rio did Kia sell in 2022?
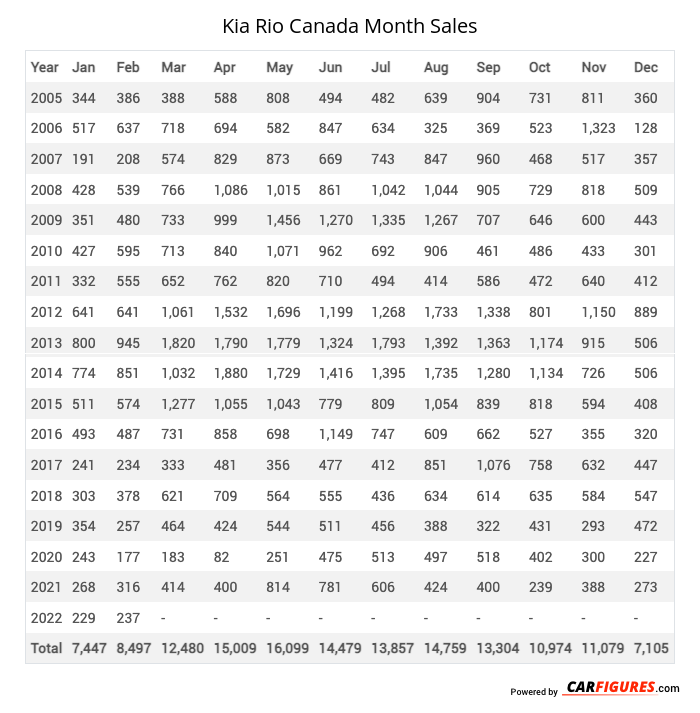
Kia sold 466 Rio in 2022. (From Jan - Feb 2022)
How many Rio did Kia sell in February 2022?
Kia sold 237 Rio in February 2022.
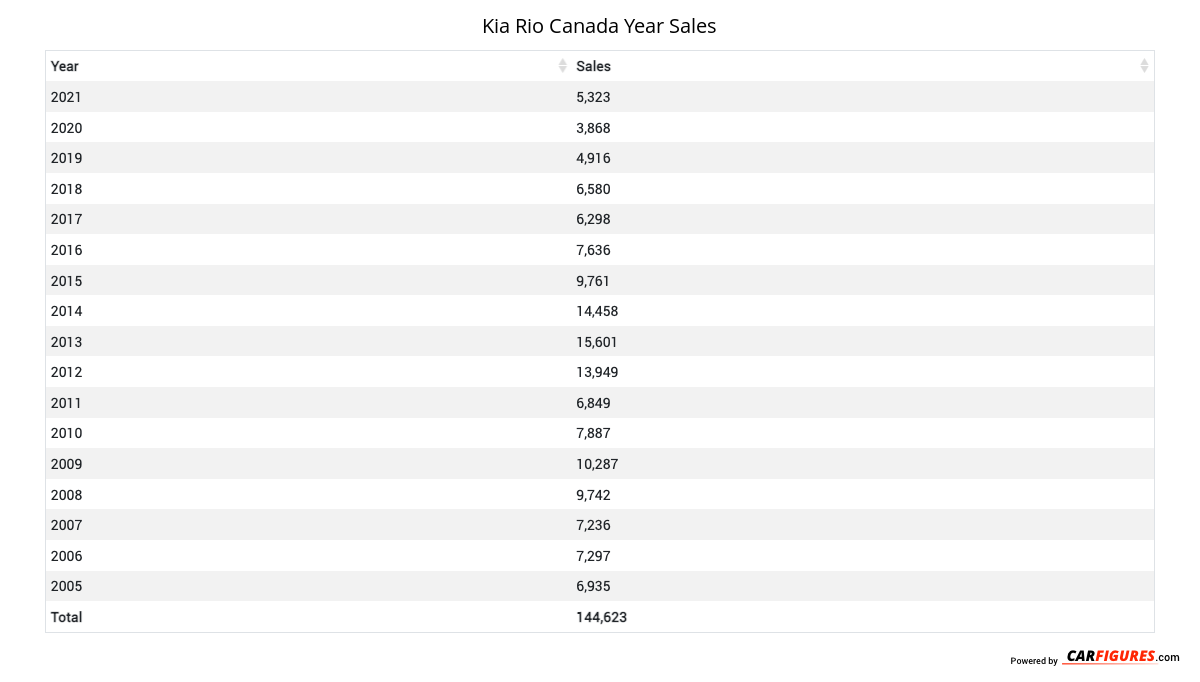
How many Rio did Kia sell in 2021?
Kia sold 5,323 Rio in 2021. In 2020, Kia sold 3,868 Rio. They sold 1,455 more units in 2021 compared to 2020 with a percent gain of 37.62% YoY.
Overview
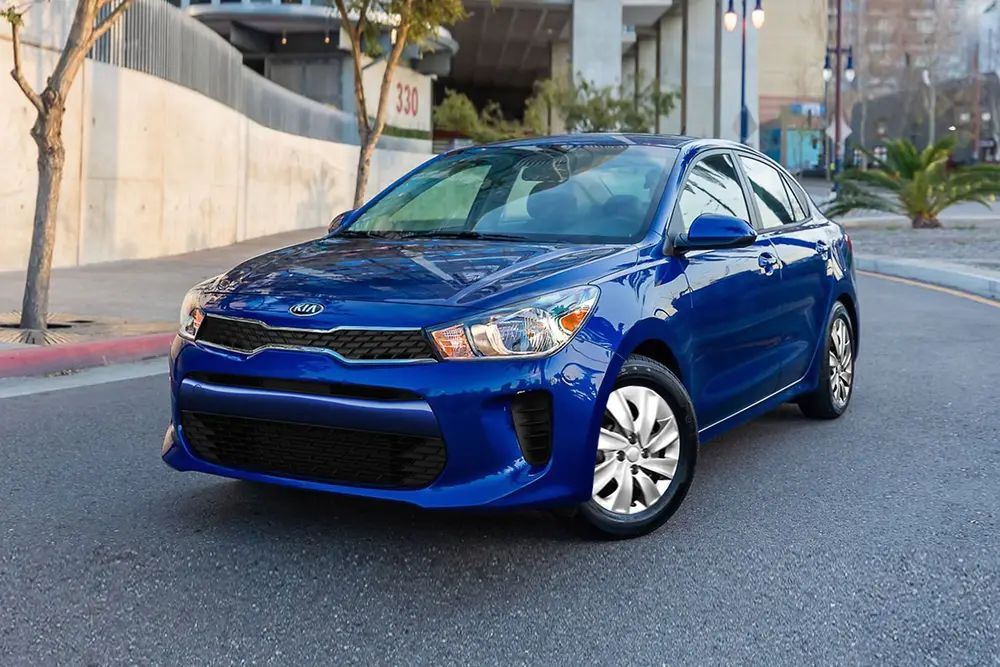
The 2020 Kia Rio is a vehicle from automaker Kia.
How Much Does the 2020 Kia Rio Cost?
The 2020 Kia Rio starts at $18,045 MSRP. Fully loaded, the Kia Rio will cost you about $20,945.
Kia Rio Engine, Transmission, and Performance Numbers
Kia Rio delivers 123 horsepower with 113 ft-lb torque delivered through a front-wheel-drive drivetrain.
List of Kia Rio Competitors
Some of Kia Rio competitors include the Mazda Mazda3, Toyota Corolla, Nissan Sentra, Hyundai Elantra, Honda Civic, Subaru Impreza, Subaru WRX, Nissan Altima, Mazda Mazda6, Toyota Camry and Kia Forte.
Kia Rio Canadian Sale figures by year, quarter, and month are presented below. Including the most up to date sales data for the Kia Rio. See how the Kia Rio stacks up the other models in the Cars, Subcompact Cars segments.
| Year | Jan | Feb | Mar | Apr | May | Jun | Jul | Aug | Sep | Oct | Nov | Dec |
|---|---|---|---|---|---|---|---|---|---|---|---|---|
| 2005 | 344 | 386 | 388 | 588 | 808 | 494 | 482 | 639 | 904 | 731 | 811 | 360 |
| 2006 | 517 | 637 | 718 | 694 | 582 | 847 | 634 | 325 | 369 | 523 | 1323 | 128 |
| 2007 | 191 | 208 | 574 | 829 | 873 | 669 | 743 | 847 | 960 | 468 | 517 | 357 |
| 2008 | 428 | 539 | 766 | 1086 | 1015 | 861 | 1042 | 1044 | 905 | 729 | 818 | 509 |
| 2009 | 351 | 480 | 733 | 999 | 1456 | 1270 | 1335 | 1267 | 707 | 646 | 600 | 443 |
| 2010 | 427 | 595 | 713 | 840 | 1071 | 962 | 692 | 906 | 461 | 486 | 433 | 301 |
| 2011 | 332 | 555 | 652 | 762 | 820 | 710 | 494 | 414 | 586 | 472 | 640 | 412 |
| 2012 | 641 | 641 | 1061 | 1532 | 1696 | 1199 | 1268 | 1733 | 1338 | 801 | 1150 | 889 |
| 2013 | 800 | 945 | 1820 | 1790 | 1779 | 1324 | 1793 | 1392 | 1363 | 1174 | 915 | 506 |
| 2014 | 774 | 851 | 1032 | 1880 | 1729 | 1416 | 1395 | 1735 | 1280 | 1134 | 726 | 506 |
| 2015 | 511 | 574 | 1277 | 1055 | 1043 | 779 | 809 | 1054 | 839 | 818 | 594 | 408 |
| 2016 | 493 | 487 | 731 | 858 | 698 | 1149 | 747 | 609 | 662 | 527 | 355 | 320 |
| 2017 | 241 | 234 | 333 | 481 | 356 | 477 | 412 | 851 | 1076 | 758 | 632 | 447 |
| 2018 | 303 | 378 | 621 | 709 | 564 | 555 | 436 | 634 | 614 | 635 | 584 | 547 |
| 2019 | 354 | 257 | 464 | 424 | 544 | 511 | 456 | 388 | 322 | 431 | 293 | 472 |
| 2020 | 243 | 177 | 183 | 82 | 251 | 475 | 513 | 497 | 518 | 402 | 300 | 227 |
| 2021 | 268 | 316 | 414 | 400 | 814 | 781 | 606 | 424 | 400 | 239 | 388 | 273 |
| 2022 | 229 | 237 | - | - | - | - | - | - | - | - | - | - |
| Total | 7447 | 8497 | 12480 | 15009 | 16099 | 14479 | 13857 | 14759 | 13304 | 10974 | 11079 | 7105 |
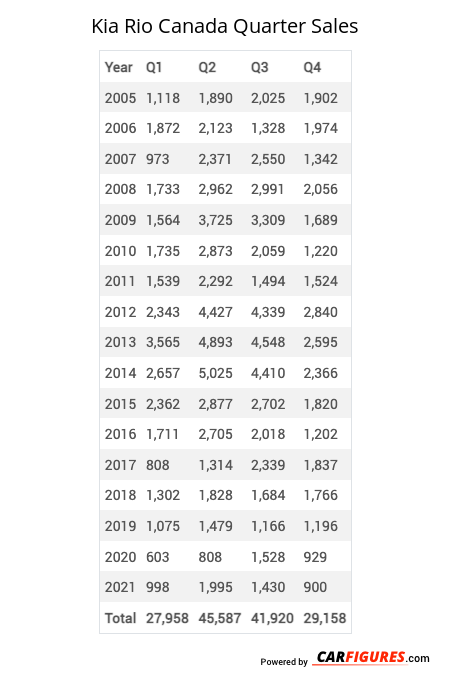
| Year | Q1 | Q2 | Q3 | Q4 |
|---|---|---|---|---|
| 2005 | 1118 | 1890 | 2025 | 1902 |
| 2006 | 1872 | 2123 | 1328 | 1974 |
| 2007 | 973 | 2371 | 2550 | 1342 |
| 2008 | 1733 | 2962 | 2991 | 2056 |
| 2009 | 1564 | 3725 | 3309 | 1689 |
| 2010 | 1735 | 2873 | 2059 | 1220 |
| 2011 | 1539 | 2292 | 1494 | 1524 |
| 2012 | 2343 | 4427 | 4339 | 2840 |
| 2013 | 3565 | 4893 | 4548 | 2595 |
| 2014 | 2657 | 5025 | 4410 | 2366 |
| 2015 | 2362 | 2877 | 2702 | 1820 |
| 2016 | 1711 | 2705 | 2018 | 1202 |
| 2017 | 808 | 1314 | 2339 | 1837 |
| 2018 | 1302 | 1828 | 1684 | 1766 |
| 2019 | 1075 | 1479 | 1166 | 1196 |
| 2020 | 603 | 808 | 1528 | 929 |
| 2021 | 998 | 1995 | 1430 | 900 |
| Total | 27958 | 45587 | 41920 | 29158 |
| Year | Sales |
|---|---|
| 2021 | 5323 |
| 2020 | 3868 |
| 2019 | 4916 |
| 2018 | 6580 |
| 2017 | 6298 |
| 2016 | 7636 |
| 2015 | 9761 |
| 2014 | 14458 |
| 2013 | 15601 |
| 2012 | 13949 |
| 2011 | 6849 |
| 2010 | 7887 |
| 2009 | 10287 |
| 2008 | 9742 |
| 2007 | 7236 |
| 2006 | 7297 |
| 2005 | 6935 |
| Total | 144623 |
Download Historic Sales Data
Embedded Code
See more widgetsSources: Manufacturers