Key Stats
How many Escape did Changan sell in 2020?
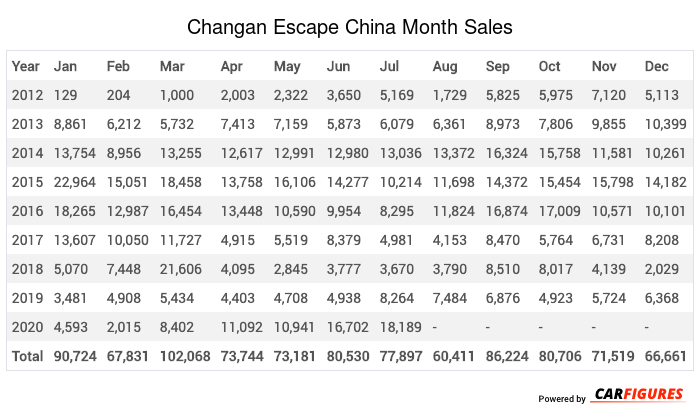
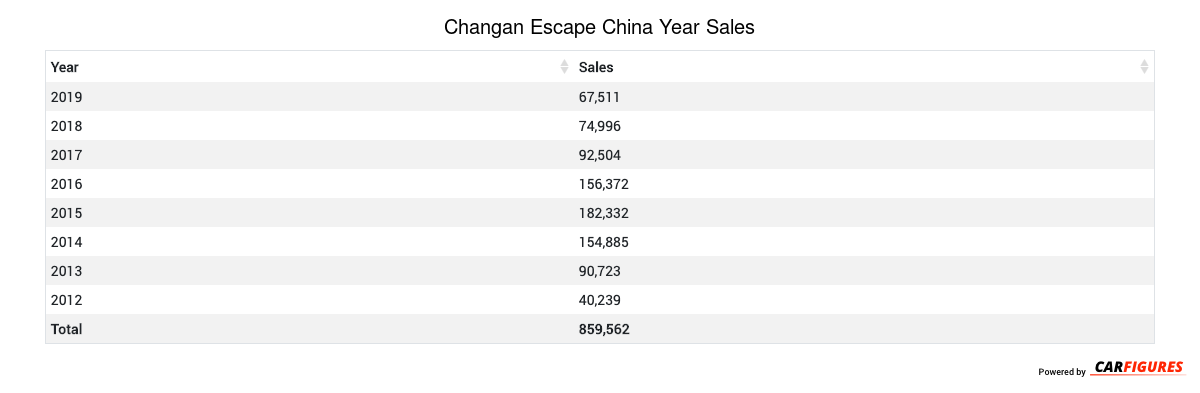
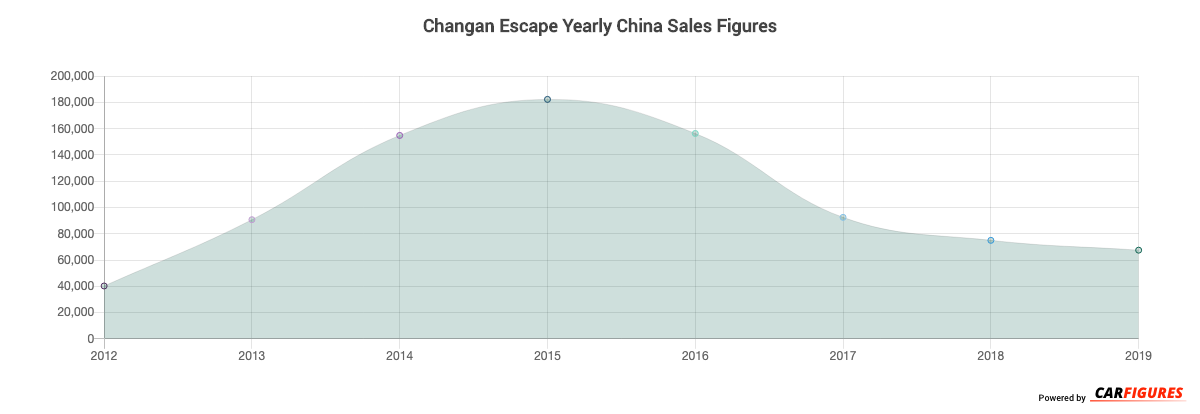
Changan sold 71,934 Escape in 2020. (From Jan - Dec 2020)
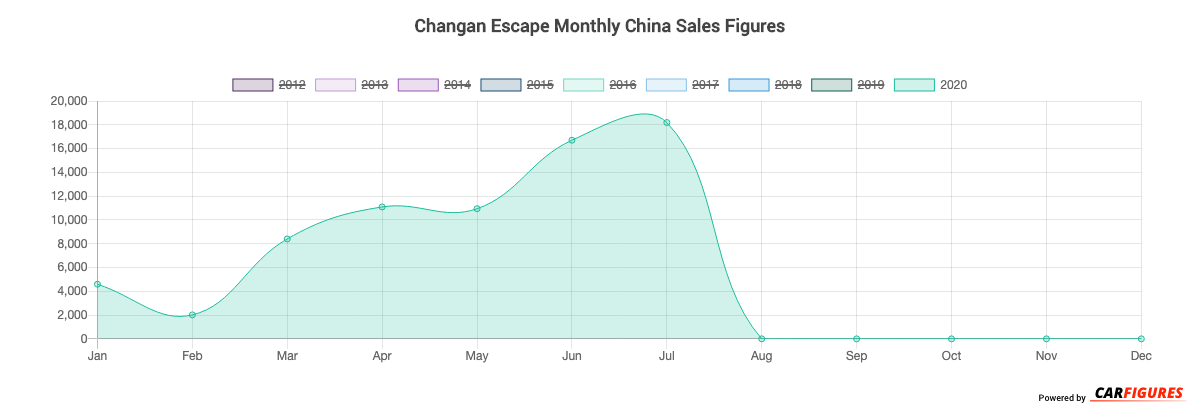
How many Escape did Changan sell in July 2020?
Changan sold 18,189 Escape in July 2020.
How many Escape did Changan sell in 2019?
Changan sold 67,511 Escape in 2019. In 2018, Changan sold 74,996 Escape. They sold 7,485 more units in year 2018 compared to 2019 with a percent loss of 9.98% YoY.
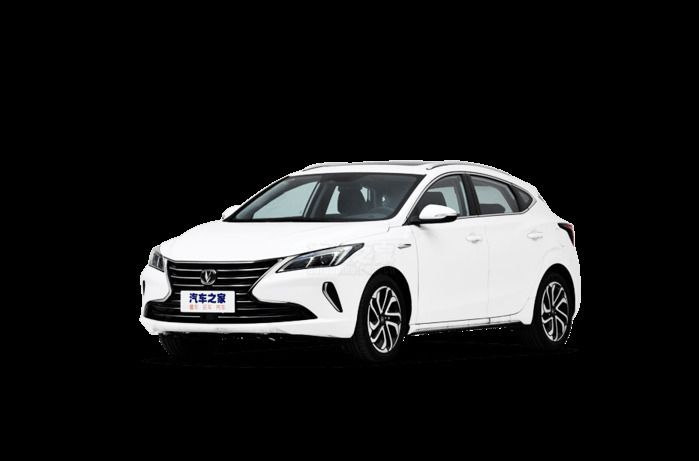
Overview
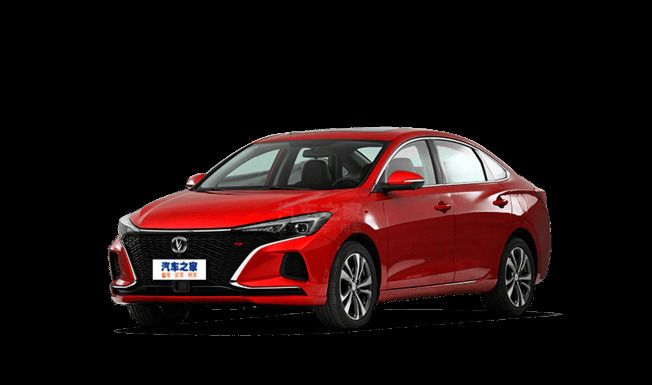
The Escape is a 4-door 5-seater sedan with room for 5 people.
How Much Does the Changan Escape Cost?
The Escape starts at CN¥74,900 Yuan ($10,486 USD) MSRP. Fully equipped, the Escape will cost you about CN¥106,900 Yuan ($14,966 USD).
Changan Escape Engine and Performance
Escape is powered by a 1.6LL engine that makes 94 Kw (126.06 HP) - 116 Kw (155.56 HP) and 161 Nm (119.14 ft-lb) - 260 Nm (192.40 ft-lb) torque.
Changan Escape Specifications
The Escape has a curb weight of 1,300 kg (2,900 lbs) - 1,400 kg (3,000 lbs).
Changan Escape China Sale figures by year, quarter, and month are presented below. Including the most up to date sales data for the Changan Escape.
| Year | Jan | Feb | Mar | Apr | May | Jun | Jul | Aug | Sep | Oct | Nov | Dec |
|---|---|---|---|---|---|---|---|---|---|---|---|---|
| 2012 | 129 | 204 | 1000 | 2003 | 2322 | 3650 | 5169 | 1729 | 5825 | 5975 | 7120 | 5113 |
| 2013 | 8861 | 6212 | 5732 | 7413 | 7159 | 5873 | 6079 | 6361 | 8973 | 7806 | 9855 | 10399 |
| 2014 | 13754 | 8956 | 13255 | 12617 | 12991 | 12980 | 13036 | 13372 | 16324 | 15758 | 11581 | 10261 |
| 2015 | 22964 | 15051 | 18458 | 13758 | 16106 | 14277 | 10214 | 11698 | 14372 | 15454 | 15798 | 14182 |
| 2016 | 18265 | 12987 | 16454 | 13448 | 10590 | 9954 | 8295 | 11824 | 16874 | 17009 | 10571 | 10101 |
| 2017 | 13607 | 10050 | 11727 | 4915 | 5519 | 8379 | 4981 | 4153 | 8470 | 5764 | 6731 | 8208 |
| 2018 | 5070 | 7448 | 21606 | 4095 | 2845 | 3777 | 3670 | 3790 | 8510 | 8017 | 4139 | 2029 |
| 2019 | 3481 | 4908 | 5434 | 4403 | 4708 | 4938 | 8264 | 7484 | 6876 | 4923 | 5724 | 6368 |
| 2020 | 4593 | 2015 | 8402 | 11092 | 10941 | 16702 | 18189 | - | - | - | - | - |
| Total | 90724 | 67831 | 102068 | 73744 | 73181 | 80530 | 77897 | 60411 | 86224 | 80706 | 71519 | 66661 |
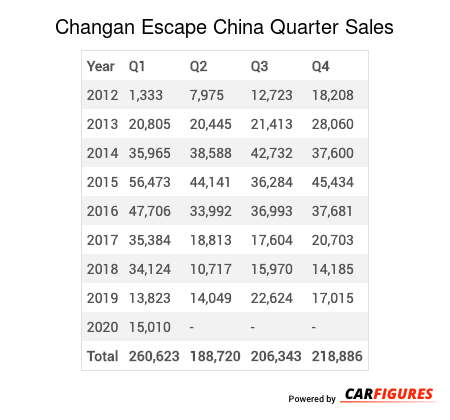
| Year | Q1 | Q2 | Q3 | Q4 |
|---|---|---|---|---|
| 2012 | 1333 | 7975 | 12723 | 18208 |
| 2013 | 20805 | 20445 | 21413 | 28060 |
| 2014 | 35965 | 38588 | 42732 | 37600 |
| 2015 | 56473 | 44141 | 36284 | 45434 |
| 2016 | 47706 | 33992 | 36993 | 37681 |
| 2017 | 35384 | 18813 | 17604 | 20703 |
| 2018 | 34124 | 10717 | 15970 | 14185 |
| 2019 | 13823 | 14049 | 22624 | 17015 |
| 2020 | 15010 | - | - | - |
| Total | 260623 | 188720 | 206343 | 218886 |
| Year | Sales |
|---|---|
| 2020 | 15010 |
| 2019 | 67511 |
| 2018 | 74996 |
| 2017 | 92504 |
| 2016 | 156372 |
| 2015 | 182332 |
| 2014 | 154885 |
| 2013 | 90723 |
| 2012 | 40239 |
| Total | 874572 |
Download Historic Sales Data

Embedded Code
See more widgetsSources: Manufacturers