Key Stats
How many X-Trail did Nissan sell in 2020?
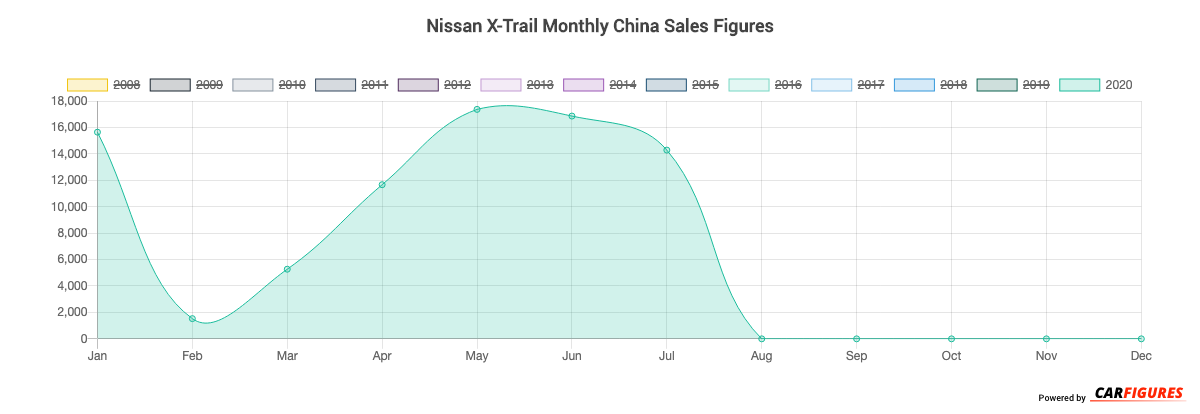
Nissan sold 82,613 X-Trail in 2020. (From Jan - Dec 2020)
How many X-Trail did Nissan sell in July 2020?
Nissan sold 14,284 X-Trail in July 2020.
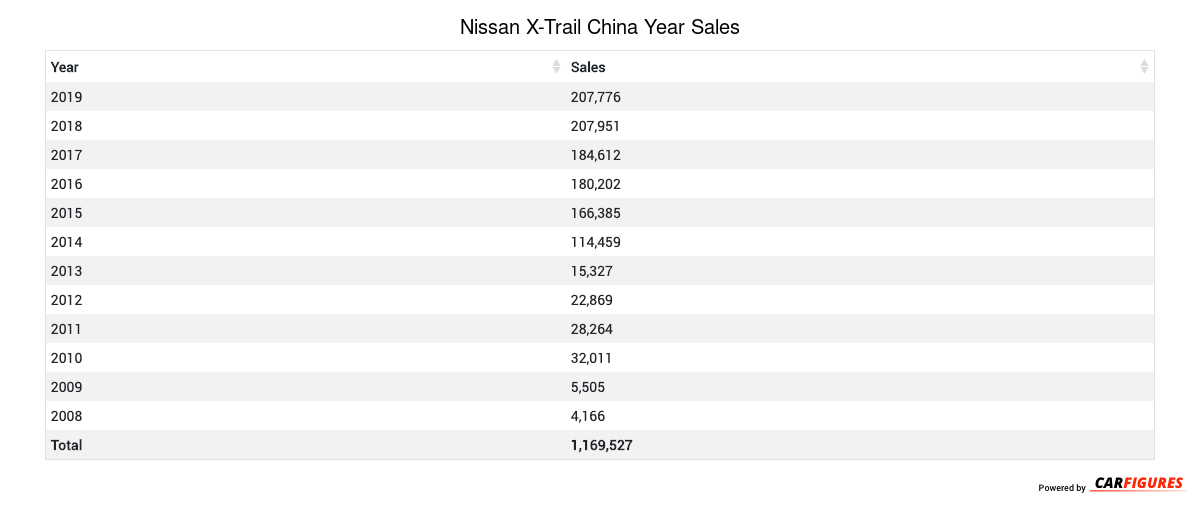
How many X-Trail did Nissan sell in 2019?
Nissan sold 207,776 X-Trail in 2019. In 2018, Nissan sold 207,951 X-Trail. They sold 175 more units in year 2018 compared to 2019 with a percent loss of 0.08% YoY.
Overview
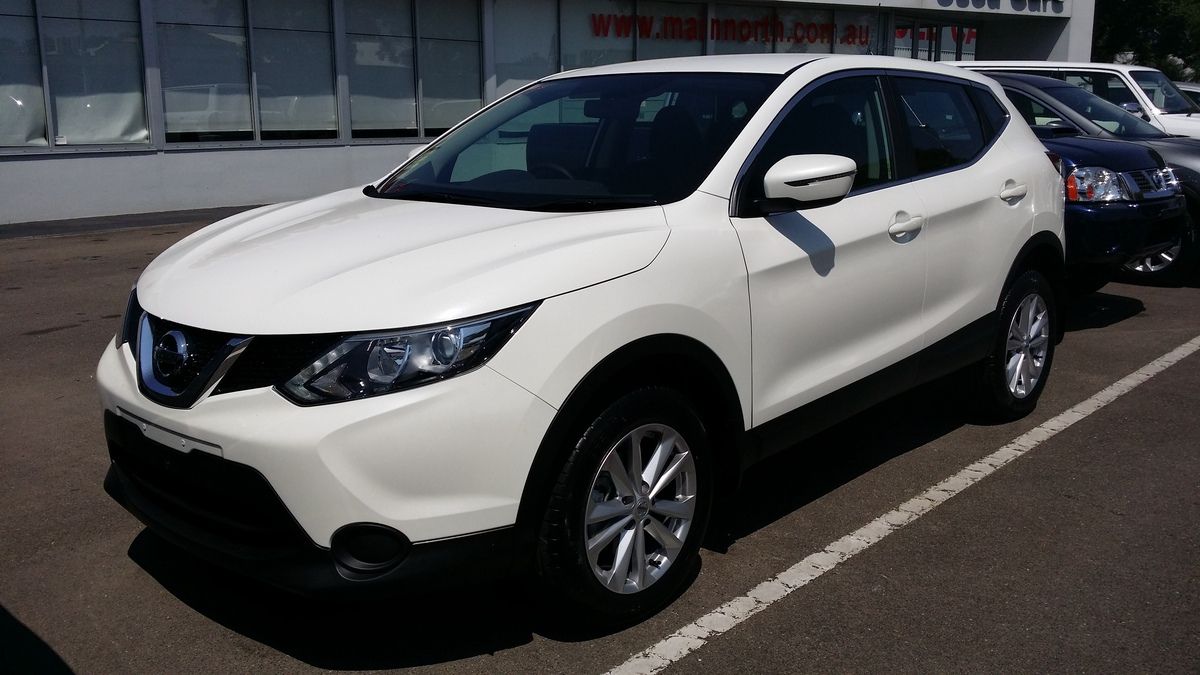
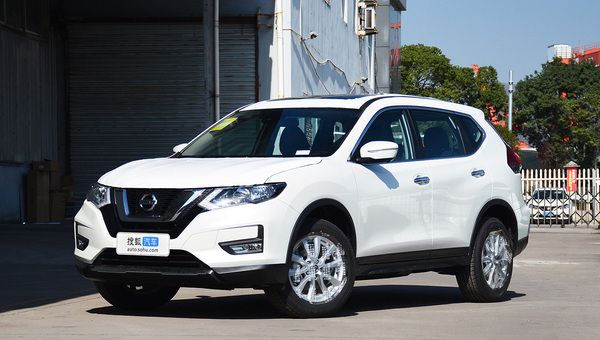
The X-Trail is a 5 doors 5 seats SUV with room for 5 people from automaker Nissan.
How Much Does the Nissan X-Trail Cost?
Pricing for the X-Trail starts at CN¥188,800 Yuan ($26,432 USD) MSRP and goes up to CN¥271,300 Yuan ($37,982 USD) fully equipped.
Nissan X-Trail Engine and Performance
X-Trail includes a 2.0LL engine. This delivers 113 Kw (151.54 HP) - 137 Kw (183.72 HP) and 204 Nm (150.96 ft-lb) - 246 Nm (182.04 ft-lb) torque.
Nissan X-Trail Specifications
The X-Trail has a curb weight of 1,500 kg (3,300 lbs) - 1,700 kg (3,700 lbs).
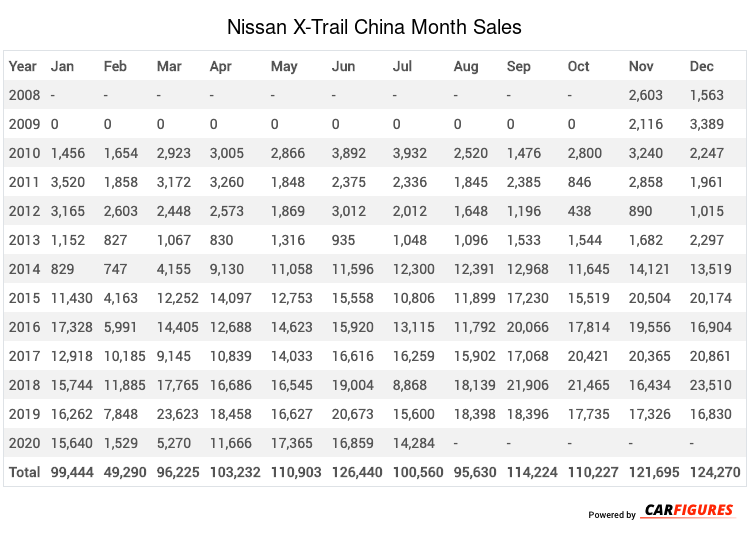
Nissan X-Trail China Sale figures by year, quarter, and month are presented below. Including the most up to date sales data for the Nissan X-Trail.
| Year | Jan | Feb | Mar | Apr | May | Jun | Jul | Aug | Sep | Oct | Nov | Dec |
|---|---|---|---|---|---|---|---|---|---|---|---|---|
| 2008 | - | - | - | - | - | - | - | - | - | - | 2603 | 1563 |
| 2009 | 0 | 0 | 0 | 0 | 0 | 0 | 0 | 0 | 0 | 0 | 2116 | 3389 |
| 2010 | 1456 | 1654 | 2923 | 3005 | 2866 | 3892 | 3932 | 2520 | 1476 | 2800 | 3240 | 2247 |
| 2011 | 3520 | 1858 | 3172 | 3260 | 1848 | 2375 | 2336 | 1845 | 2385 | 846 | 2858 | 1961 |
| 2012 | 3165 | 2603 | 2448 | 2573 | 1869 | 3012 | 2012 | 1648 | 1196 | 438 | 890 | 1015 |
| 2013 | 1152 | 827 | 1067 | 830 | 1316 | 935 | 1048 | 1096 | 1533 | 1544 | 1682 | 2297 |
| 2014 | 829 | 747 | 4155 | 9130 | 11058 | 11596 | 12300 | 12391 | 12968 | 11645 | 14121 | 13519 |
| 2015 | 11430 | 4163 | 12252 | 14097 | 12753 | 15558 | 10806 | 11899 | 17230 | 15519 | 20504 | 20174 |
| 2016 | 17328 | 5991 | 14405 | 12688 | 14623 | 15920 | 13115 | 11792 | 20066 | 17814 | 19556 | 16904 |
| 2017 | 12918 | 10185 | 9145 | 10839 | 14033 | 16616 | 16259 | 15902 | 17068 | 20421 | 20365 | 20861 |
| 2018 | 15744 | 11885 | 17765 | 16686 | 16545 | 19004 | 8868 | 18139 | 21906 | 21465 | 16434 | 23510 |
| 2019 | 16262 | 7848 | 23623 | 18458 | 16627 | 20673 | 15600 | 18398 | 18396 | 17735 | 17326 | 16830 |
| 2020 | 15640 | 1529 | 5270 | 11666 | 17365 | 16859 | 14284 | - | - | - | - | - |
| Total | 99444 | 49290 | 96225 | 103232 | 110903 | 126440 | 100560 | 95630 | 114224 | 110227 | 121695 | 124270 |
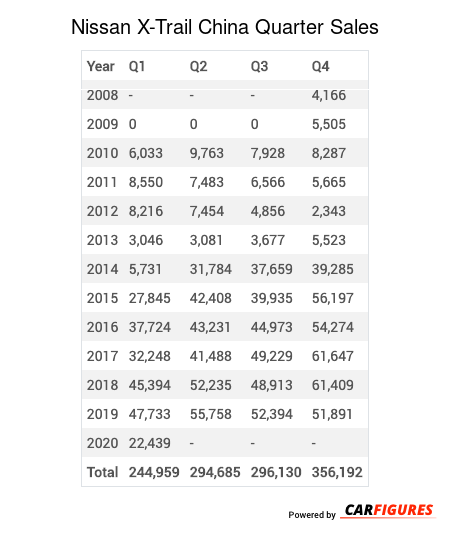
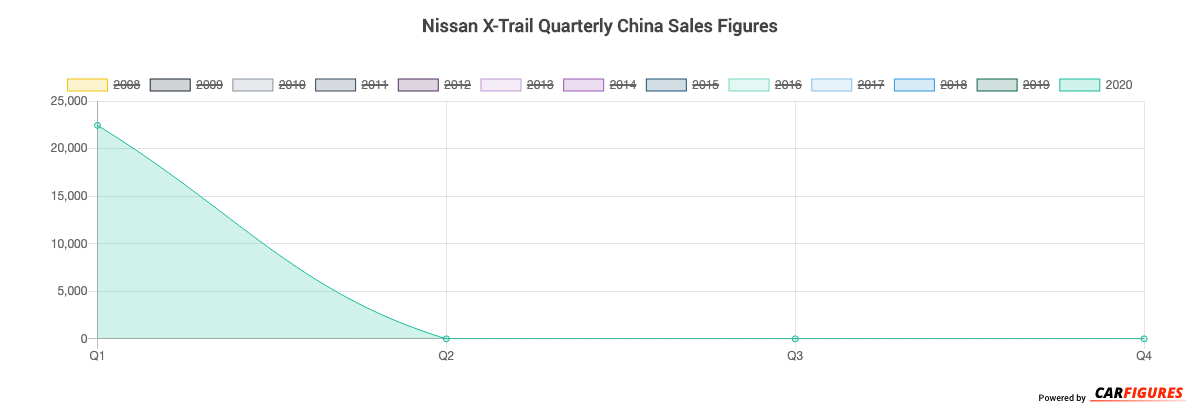
| Year | Q1 | Q2 | Q3 | Q4 |
|---|---|---|---|---|
| 2008 | - | - | - | 4166 |
| 2009 | 0 | 0 | 0 | 5505 |
| 2010 | 6033 | 9763 | 7928 | 8287 |
| 2011 | 8550 | 7483 | 6566 | 5665 |
| 2012 | 8216 | 7454 | 4856 | 2343 |
| 2013 | 3046 | 3081 | 3677 | 5523 |
| 2014 | 5731 | 31784 | 37659 | 39285 |
| 2015 | 27845 | 42408 | 39935 | 56197 |
| 2016 | 37724 | 43231 | 44973 | 54274 |
| 2017 | 32248 | 41488 | 49229 | 61647 |
| 2018 | 45394 | 52235 | 48913 | 61409 |
| 2019 | 47733 | 55758 | 52394 | 51891 |
| 2020 | 22439 | - | - | - |
| Total | 244959 | 294685 | 296130 | 356192 |
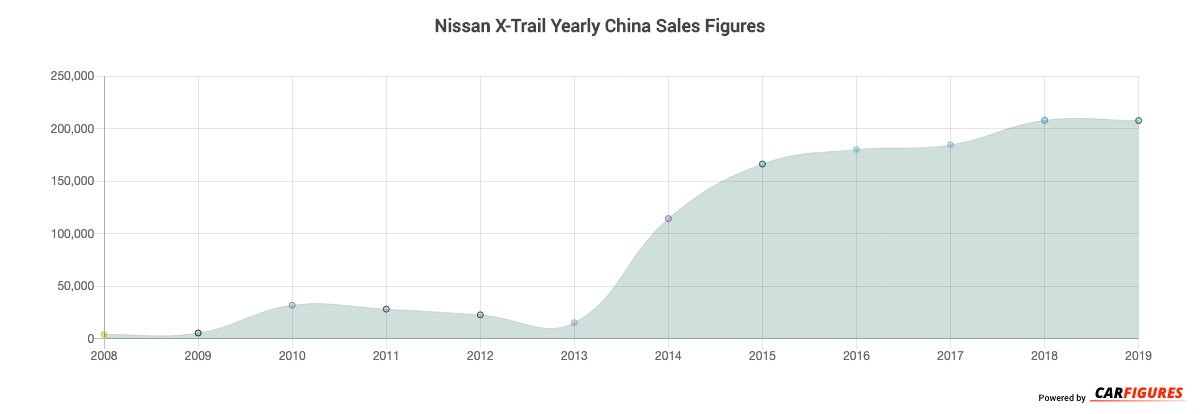
| Year | Sales |
|---|---|
| 2020 | 22439 |
| 2019 | 207776 |
| 2018 | 207951 |
| 2017 | 184612 |
| 2016 | 180202 |
| 2015 | 166385 |
| 2014 | 114459 |
| 2013 | 15327 |
| 2012 | 22869 |
| 2011 | 28264 |
| 2010 | 32011 |
| 2009 | 5505 |
| 2008 | 4166 |
| Total | 1191966 |
Download Historic Sales Data
Embedded Code
See more widgetsSources: Manufacturers