Last updated: January 31, 2020
us-auto-market-2016-q1-best-sellers-promo-hlcLucDf

Key Stats

What is the best selling vehicle in 2016 Q1?

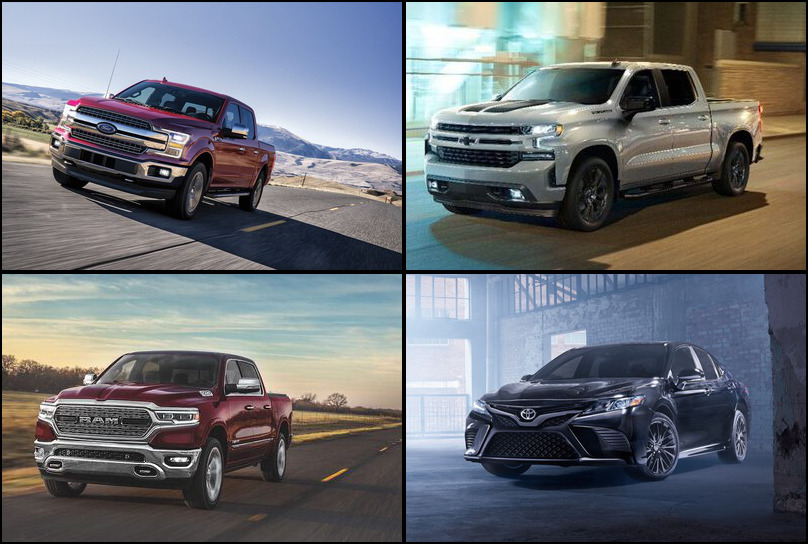
The best selling vehicle in 2016 Q1 is the Ford F-Series with 186,121 units in sales volume this quarter.

What is the best selling car in 2016 Q1?

The best selling car in 2016 Q1 is the Toyota Camry with 96,244 units in sales volume this quarter.

What is the best selling crossover/SUV in 2016 Q1?

The best selling crossover/SUV in 2016 Q1 is the Toyota RAV4 with 76,122 units in sales volume this quarter.

What is the best selling pickup truck in 2016 Q1?

The best selling pickup truck in 2016 Q1 is the Ford F-Series with 186,121 units in sales volume this quarter.


Rank Name 2016_Q1 Δ 2015_Q1 Δ 2015_Q4 Year to Date 2015_Q1 2015_Q4
1 Ford F-Series 186121 5 -14 820799 177312 215903
2 Chevrolet Silverado 128965 2 -19 574876 126694 159640
3 Ram Ram Pickup 113367 12 -6 487558 101511 120473
4 Toyota Camry 96244 -4 -7 388616 100505 103025
5 Honda Civic 87303 31 2 366927 66722 85635
6 Nissan Altima 85332 -2 20 307380 86875 70974
7 Toyota Corolla 84260 -7 -2 366129 90728 85681
8 Honda Accord 77073 12 -15 322225 68645 90743
9 Toyota RAV4 76122 14 -13 352139 67010 87490
10 Ford Fusion 74994 5 9 265840 71470 68695
11 Ford Escape 71594 6 -3 307069 67272 73480
12 Honda CR-V 71188 -3 -17 357335 73127 86148
13 Nissan Rogue 69036 7 -7 329904 64486 73983
14 Nissan Sentra 62944 23 28 214709 51026 49239
15 Hyundai Sonata 61457 38 10 199408 44690 55623
Rank Name 2016_Q1 Δ 2015_Q1 Δ 2015_Q4 Year to Date 2015_Q1 2015_Q4
1 Toyota Camry 96244 -4 -7 388616 100505 103025
2 Honda Civic 87303 31 2 366927 66722 85635
3 Nissan Altima 85332 -2 20 307380 86875 70974
4 Toyota Corolla 84260 -7 -2 366129 90728 85681
5 Honda Accord 77073 12 -15 322225 68645 90743
6 Ford Fusion 74994 5 9 265840 71470 68695
7 Nissan Sentra 62944 23 28 214709 51026 49239
8 Hyundai Sonata 61457 38 10 199408 44690 55623
9 Chevrolet Malibu 58222 37 22 227881 42401 47693
10 Ford Focus 50215 -5 30 168789 52994 38614
Rank Name 2016_Q1 Δ 2015_Q1 Δ 2015_Q4 Year to Date 2015_Q1 2015_Q4
1 Toyota RAV4 76122 14 -13 352139 67010 87490
2 Ford Escape 71594 6 -3 307069 67272 73480
3 Honda CR-V 71188 -3 -17 357335 73127 86148
4 Nissan Rogue 69036 7 -7 329904 64486 73983
5 Chevrolet Equinox 59879 -9 -6 242195 65613 63547
6 Ford Explorer 55885 1 6 216294 55080 52781
7 Jeep Cherokee 49534 3 -16 201420 48213 59148
8 Jeep Grand Cherokee 47050 8 -13 212704 43377 54109
9 Jeep Wrangler 41741 -1 -8 191788 42118 45189
10 Toyota Highlander 38673 9 -8 191379 35362 42157
Rank Name 2016_Q1 Δ 2015_Q1 Δ 2015_Q4 Year to Date 2015_Q1 2015_Q4
1 Ford F-Series 186121 5 -14 820799 177312 215903
2 Chevrolet Silverado 128965 2 -19 574876 126694 159640
3 Ram Ram Pickup 113367 12 -6 487558 101511 120473
4 GMC Sierra 51131 13 -18 225828 45173 62486
5 Toyota Tacoma 44576 12 -3 191631 39666 45890
6 Toyota Tundra 25535 -11 -13 115489 28757 29254
7 Chevrolet Colorado 22620 18 7 108725 19126 21198
8 Nissan Frontier 21395 12 38 86926 19102 15556
9 GMC Canyon 7577 6 -1 36401 7152 7651
10 Nissan Titan 3271 24 25 21880 2638 2619

Download Historic Sales Data
Looking for more data/visualizations? Send us an email at [email protected] for customized data aggregates and visualizations.