Last updated: January 31, 2020
us-auto-market-2016-q2-best-sellers-promo-goxpwfCE

Key Stats

What is the best selling vehicle in 2016 Q2?

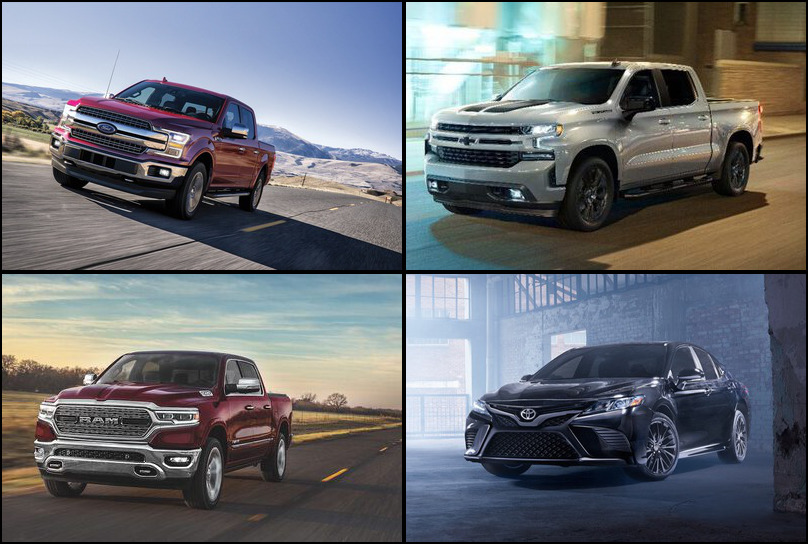
The best selling vehicle in 2016 Q2 is the Ford F-Series with 209,123 units in sales volume this quarter.

What is the best selling car in 2016 Q2?

The best selling car in 2016 Q2 is the Toyota Camry with 103,516 units in sales volume this quarter.

What is the best selling crossover/SUV in 2016 Q2?

The best selling crossover/SUV in 2016 Q2 is the Toyota RAV4 with 89,778 units in sales volume this quarter.

What is the best selling pickup truck in 2016 Q2?

The best selling pickup truck in 2016 Q2 is the Ford F-Series with 209,123 units in sales volume this quarter.


Rank Name 2016_Q2 Δ 2015_Q2 Δ 2016_Q1 Year to Date 2015_Q2 2016_Q1
1 Ford F-Series 209123 16 12 820799 179868 186121
2 Chevrolet Silverado 144687 -3 12 574876 149128 128965
3 Ram Ram Pickup 118038 6 4 487558 111205 113367
4 Toyota Camry 103516 -10 8 388616 115311 96244
5 Honda Civic 102537 12 17 366927 91579 87303
6 Toyota Corolla 97933 -1 16 366129 99403 84260
7 Honda Accord 92281 6 20 322225 87101 77073
8 Toyota RAV4 89778 17 18 352139 76565 76122
9 Honda CR-V 87887 -2 23 357335 89891 71188
10 Nissan Altima 87363 3 2 307380 85156 85332
11 Ford Escape 83784 6 17 307069 79144 71594
12 Nissan Rogue 79847 13 16 329904 70911 69036
13 Ford Fusion 71839 -12 -4 265840 81688 74994
14 Chevrolet Malibu 62103 15 7 227881 54119 58222
15 Chevrolet Equinox 61441 -23 3 242195 80072 59879
Rank Name 2016_Q2 Δ 2015_Q2 Δ 2016_Q1 Year to Date 2015_Q2 2016_Q1
1 Toyota Camry 103516 -10 8 388616 115311 96244
2 Honda Civic 102537 12 17 366927 91579 87303
3 Toyota Corolla 97933 -1 16 366129 99403 84260
4 Honda Accord 92281 6 20 322225 87101 77073
5 Nissan Altima 87363 3 2 307380 85156 85332
6 Ford Fusion 71839 -12 -4 265840 81688 74994
7 Chevrolet Malibu 62103 15 7 227881 54119 58222
8 Nissan Sentra 60070 9 -5 214709 54875 62944
9 Hyundai Elantra 56943 -21 45 208319 71956 39363
10 Ford Focus 52929 -17 5 168789 64085 50215
Rank Name 2016_Q2 Δ 2015_Q2 Δ 2016_Q1 Year to Date 2015_Q2 2016_Q1
1 Toyota RAV4 89778 17 18 352139 76565 76122
2 Honda CR-V 87887 -2 23 357335 89891 71188
3 Ford Escape 83784 6 17 307069 79144 71594
4 Nissan Rogue 79847 13 16 329904 70911 69036
5 Chevrolet Equinox 61441 -23 3 242195 80072 59879
6 Jeep Wrangler 58614 -3 40 191788 60332 41741
7 Ford Explorer 56452 0 1 216294 56717 55885
8 Jeep Grand Cherokee 53687 8 14 212704 49703 47050
9 Jeep Cherokee 53118 -7 7 201420 57213 49534
10 Toyota Highlander 43256 1 12 191379 43026 38673
Rank Name 2016_Q2 Δ 2015_Q2 Δ 2016_Q1 Year to Date 2015_Q2 2016_Q1
1 Ford F-Series 209123 16 12 820799 179868 186121
2 Chevrolet Silverado 144687 -3 12 574876 149128 128965
3 Ram Ram Pickup 118038 6 4 487558 111205 113367
4 GMC Sierra 55335 -1 8 225828 55677 51131
5 Toyota Tacoma 50459 3 13 191631 49135 44576
6 Toyota Tundra 29431 -9 15 115489 32257 25535
7 Chevrolet Colorado 28607 27 26 108725 22449 22620
8 Nissan Frontier 23616 50 10 86926 15703 21395
9 GMC Canyon 9785 24 29 36401 7865 7577
10 Nissan Titan 2828 -17 -14 21880 3411 3271

Download Historic Sales Data
Looking for more data/visualizations? Send us an email at [email protected] for customized data aggregates and visualizations.