Last updated: January 31, 2020

Total Sales


Key Stats

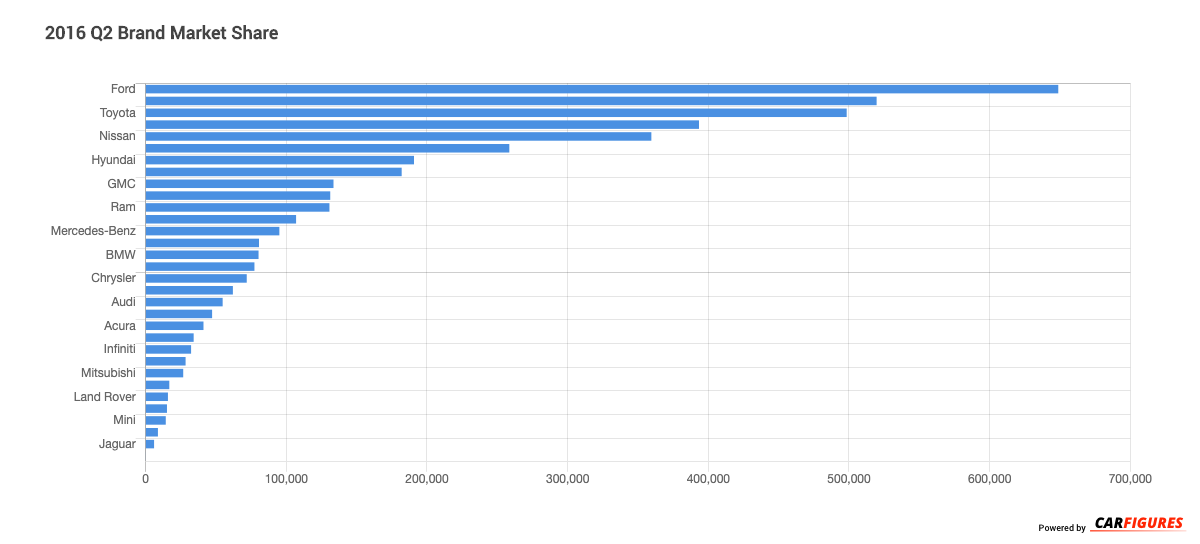
What automotive brand sold the most vehicles in 2016 Q2?

The brand that sold the most vehicles in 2016 Q2 is Ford with 648,788 units in sales volume this quarter.

What automotive brand had the biggest growth from 2016 Q1 to 2016 Q2?

The automotive brand that had the biggest growth from 2015 Q1 to 2016 Q2 is Mini with a gain of 32%.

What automotive brand had the biggest decline from 2016 Q1 to 2016 Q2?

The automotive brand that had the biggest decline from 2016 Q1 to 2016 Q2 is Land Rover with a large loss of 24%.

What automotive brand had the biggest growth from 2015 Q2 to 2016 Q2?

The automotive brand that had the biggest growth from 2015 Q2 to 2016 Q2 is Jaguar with a gain of 75%.

What automotive brand had the biggest decline from 2015 Q2 to 2016 Q2?

The automotive brand that had the biggest decline from 2015 Q2 to 2016 Q2 is Chrysler with a large loss of 19%.


Rank Name 2016_Q2 Δ 2015_Q2 Δ 2016_Q1 Year to Date 2015_Q2 2016_Q1
1 Ford 648788 0 9 2391477 647026 594149
2 Chevrolet 519646 -8 11 2058384 565371 468851
3 Toyota 498363 -3 12 1934641 514653 446313
4 Honda 393370 7 23 1452783 368617 319243
5 Nissan 359510 10 0 1400258 325391 358660
6 Jeep 258534 16 23 929446 222940 209597
7 Hyundai 190773 1 17 739885 188585 163330
8 Kia 182006 7 24 647598 169852 146321
9 GMC 133539 -8 10 543154 144902 121048
10 Dodge 131231 -2 -7 506556 133631 140512
11 Ram 130659 8 3 542884 120540 126313
12 Subaru 106946 2 12 432234 105307 95126
13 Mercedes-Benz 95063 3 16 372162 91985 81968
14 Mazda 80584 2 25 297395 78626 64438
15 BMW 80260 -9 15 303955 87964 69676
16 Lexus 77342 -5 4 331222 81667 74216
17 Chrysler 71866 -19 10 239492 88315 65506
18 Volkswagen 62012 -10 16 245207 69027 53520
19 Audi 54739 3 31 209477 53324 41933
20 Buick 47246 -15 -11 222425 55547 52890
21 Acura 41117 -13 9 161090 47418 37875
22 Cadillac 34131 -16 5 153873 40396 32547
23 Infiniti 32308 19 -1 138234 27155 32612
24 Lincoln 28392 11 11 112470 25634 25652
25 Mitsubishi 26710 4 2 97173 25697 26204
26 Volvo 16815 47 23 65174 11430 13724
27 Land Rover 15842 3 -24 73858 15324 20803
28 Porsche 15157 11 24 57864 13631 12237
29 Mini 14305 -18 32 52030 17483 10839
30 Fiat 8726 -19 -3 33777 10760 9009
31 Jaguar 5993 75 20 31240 3416 4995
32 Alfa Romeo 140 36 -17 528 103 169

Download Historic Sales Data
Looking for more data/visualizations? Send us an email at [email protected] for customized data aggregates and visualizations.