Last updated: January 31, 2020
us-auto-market-2016-q3-best-sellers-promo-nwjzzuYp

Key Stats

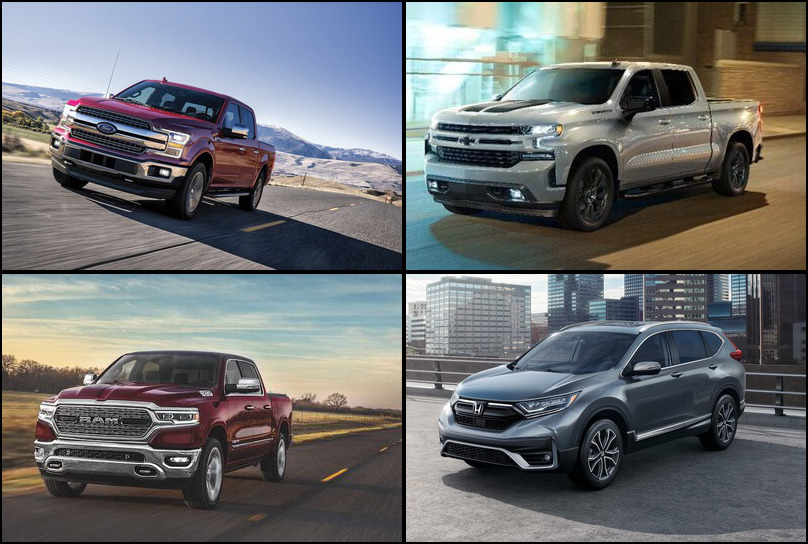
What is the best selling vehicle in 2016 Q3?

The best selling vehicle in 2016 Q3 is the Ford F-Series with 200,412 units in sales volume this quarter.

What is the best selling car in 2016 Q3?

The best selling car in 2016 Q3 is the Toyota Camry with 97,693 units in sales volume this quarter.

What is the best selling crossover/SUV in 2016 Q3?

The best selling crossover/SUV in 2016 Q3 is the Honda CR-V with 104,418 units in sales volume this quarter.

What is the best selling pickup truck in 2016 Q3?

The best selling pickup truck in 2016 Q3 is the Ford F-Series with 200,412 units in sales volume this quarter.


Rank Name 2016_Q3 Δ 2015_Q3 Δ 2016_Q2 Year to Date 2015_Q3 2016_Q2
1 Ford F-Series 200412 -3 -4 820799 207271 209123
2 Chevrolet Silverado 151904 -8 5 574876 165082 144687
3 Ram Ram Pickup 127821 8 8 487558 117927 118038
4 Honda CR-V 104418 8 19 357335 96481 87887
5 Toyota Camry 97693 -12 -6 388616 110514 103516
6 Toyota Corolla 94730 7 -3 366129 88611 97933
7 Toyota RAV4 94480 12 5 352139 84347 89778
8 Honda Civic 93943 3 -8 366927 91448 102537
9 Nissan Rogue 92736 19 16 329904 77810 79847
10 Honda Accord 89265 -18 -3 322225 109068 92281
11 Ford Escape 79386 -8 -5 307069 86596 83784
12 Nissan Altima 69626 -23 -20 307380 90393 87363
13 Ford Fusion 63629 -19 -11 265840 78317 71839
14 Hyundai Elantra 60744 -7 7 208319 65264 56943
15 GMC Sierra 57974 -5 5 225828 60803 55335
Rank Name 2016_Q3 Δ 2015_Q3 Δ 2016_Q2 Year to Date 2015_Q3 2016_Q2
1 Toyota Camry 97693 -12 -6 388616 110514 103516
2 Toyota Corolla 94730 7 -3 366129 88611 97933
3 Honda Civic 93943 3 -8 366927 91448 102537
4 Honda Accord 89265 -18 -3 322225 109068 92281
5 Nissan Altima 69626 -23 -20 307380 90393 87363
6 Ford Fusion 63629 -19 -11 265840 78317 71839
7 Hyundai Elantra 60744 -7 7 208319 65264 56943
8 Chevrolet Cruze 51281 2 4 190876 50032 49490
9 Hyundai Sonata 50870 -18 18 199408 61859 42944
10 Chevrolet Malibu 50064 -1 -19 227881 50641 62103
Rank Name 2016_Q3 Δ 2015_Q3 Δ 2016_Q2 Year to Date 2015_Q3 2016_Q2
1 Honda CR-V 104418 8 19 357335 96481 87887
2 Toyota RAV4 94480 12 5 352139 84347 89778
3 Nissan Rogue 92736 19 16 329904 77810 79847
4 Ford Escape 79386 -8 -5 307069 86596 83784
5 Jeep Cherokee 57378 3 8 201420 55686 53118
6 Jeep Grand Cherokee 53620 10 0 212704 48769 53687
7 Chevrolet Equinox 52416 -23 -15 242195 68357 61441
8 Ford Explorer 51576 -17 -9 216294 62024 56452
9 Subaru Forester 50397 3 20 178593 48740 41828
10 Jeep Wrangler 48286 -12 -18 191788 55063 58614
Rank Name 2016_Q3 Δ 2015_Q3 Δ 2016_Q2 Year to Date 2015_Q3 2016_Q2
1 Ford F-Series 200412 -3 -4 820799 207271 209123
2 Chevrolet Silverado 151904 -8 5 574876 165082 144687
3 Ram Ram Pickup 127821 8 8 487558 117927 118038
4 GMC Sierra 57974 -5 5 225828 60803 55335
5 Toyota Tacoma 47676 6 -6 191631 44871 50459
6 Toyota Tundra 29856 4 1 115489 28612 29431
7 Chevrolet Colorado 28820 33 1 108725 21657 28607
8 Nissan Frontier 24377 96 3 86926 12456 23616
9 Honda Ridgeline 10273 85508 315 23669 12 2473
10 GMC Canyon 9844 33 1 36401 7409 9785

Download Historic Sales Data
Looking for more data/visualizations? Send us an email at [email protected] for customized data aggregates and visualizations.