Last updated: April 07, 2023
Key Stats
How many cars did Land Rover sell in 2023?
Land Rover sold 14,817 vehicles in 2023. In 2022, Land Rover sold 28,989 vehicles. They sold 14,172 more vehicles in year 2022 compared to 2023 with a percent loss of 48.89% YoY.
Land Rover Total US Sales Statistics by Year
Land Rover Total US Sales Statistics by Quarter
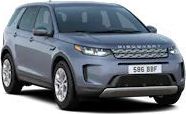
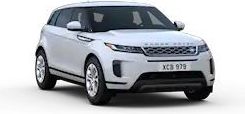
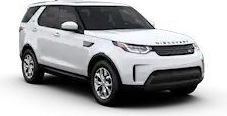
Current Lineup


Future Models
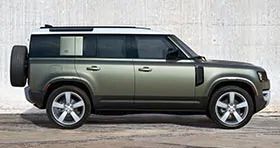
Land Rover includes the cars 2024 Defender, 2016 Discovery / LR3 / LR4, 2024 Discovery Sport, 2024 Range Rover, 2024 Range Rover Evoque, 2024 Range Rover Sport, 2024 Range Rover Velar
Land Rover Total US Quarter Sales Table
| Year | Q1 | Q2 | Q3 | Q4 |
|---|---|---|---|---|
| 2005 | 2515 | 3149 | 8362 | 9845 |
| 2006 | 7091 | 7205 | 6765 | 9740 |
| 2007 | 6710 | 6439 | 7954 | 8202 |
| 2008 | 5468 | 5190 | 3110 | 0 |
| 2009 | 1459 | 3944 | 4885 | 5962 |
| 2010 | 4727 | 5413 | 4772 | 6190 |
| 2011 | 5743 | 6274 | 5828 | 8840 |
| 2012 | 10209 | 7817 | 8030 | 9483 |
| 2013 | 9755 | 8200 | 9603 | 12044 |
| 2014 | 10883 | 11164 | 9666 | 11454 |
| 2015 | 16919 | 15324 | 16086 | 22178 |
| 2016 | 20803 | 15842 | 17743 | 19470 |
| 2017 | 19875 | 15964 | 18229 | 20258 |
| 2018 | 24246 | 20533 | 20354 | 27010 |
| 2019 | 25028 | 21095 | 20516 | 28097 |
| 2020 | 21934 | 14500 | 15900 | 27700 |
| 2021 | 21954 | 17255 | 18900 | 32600 |
| 2022 | 17400 | 10471 | 0 | 1118 |
| 2023 | 14817 | - | - | - |
Land Rover Total US Year Sales Table
| Year | Sales |
|---|---|
| 2023 | 14817 |
| 2022 | 28989 |
| 2021 | 90709 |
| 2020 | 80034 |
| 2019 | 94736 |
| 2018 | 92143 |
| 2017 | 74326 |
| 2016 | 73858 |
| 2015 | 70507 |
| 2014 | 43167 |
| 2013 | 39602 |
| 2012 | 35539 |
| 2011 | 26685 |
| 2010 | 21102 |
| 2009 | 16250 |
| 2008 | 13768 |
| 2007 | 29305 |
| 2006 | 30801 |
| 2005 | 23871 |
| Total | 900209 |