Last updated: July 06, 2023
Key Stats
How many cars did Ram sell in 2023?
Ram sold 270,736 vehicles in 2023. In 2022, Ram sold 545,195 vehicles. They sold 274,459 more vehicles in year 2022 compared to 2023 with a percent loss of 50.34% YoY.
Ram Total US Sales Statistics by Year
Ram Total US Sales Statistics by Quarter
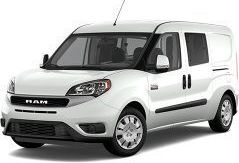
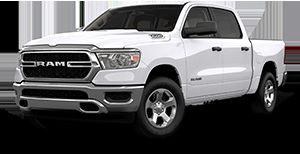
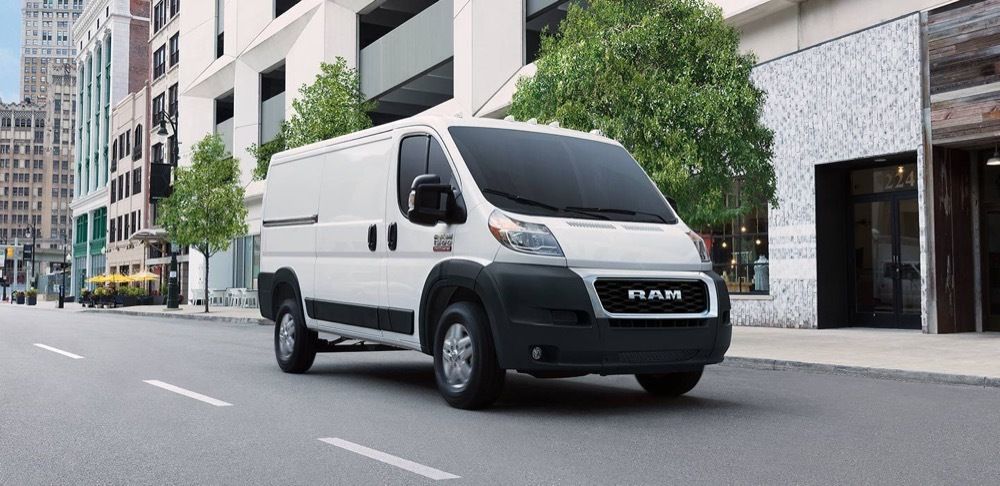
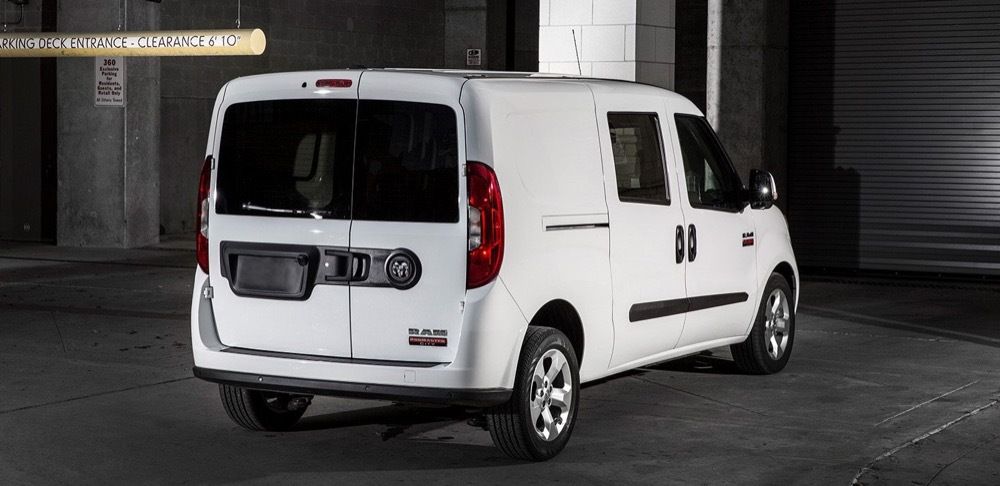
Current Lineup
Discontinued Models

Ram includes the cars 2015 Cargo Van, 2011 Dakota, 2024 ProMaster, 2024 ProMaster City, 2024 Ram Pickup
Ram Total US Quarter Sales Table
| Year | Q1 | Q2 | Q3 | Q4 |
|---|---|---|---|---|
| 2005 | 114187 | 137281 | 153587 | 99539 |
| 2006 | 109394 | 114277 | 113027 | 103577 |
| 2007 | 106712 | 107700 | 104142 | 90643 |
| 2008 | 77629 | 68694 | 71361 | 54200 |
| 2009 | 50976 | 50273 | 50840 | 35859 |
| 2010 | 41036 | 50612 | 59651 | 61400 |
| 2011 | 56824 | 63274 | 68667 | 68845 |
| 2012 | 69495 | 72988 | 73877 | 81568 |
| 2013 | 79354 | 95708 | 94234 | 98547 |
| 2014 | 100993 | 113364 | 122791 | 131991 |
| 2015 | 110406 | 120540 | 127542 | 135319 |
| 2016 | 126313 | 130659 | 140361 | 145551 |
| 2017 | 132579 | 147016 | 139098 | 138097 |
| 2018 | 113654 | 146687 | 156320 | 180707 |
| 2019 | 137013 | 196155 | 179200 | 190655 |
| 2020 | 140486 | 127683 | 175175 | 181297 |
| 2021 | 162920 | 187750 | 144740 | 151918 |
| 2022 | 138153 | 137873 | 139295 | 129874 |
| 2023 | 128722 | - | - | - |
Ram Total US Year Sales Table
| Year | Sales |
|---|---|
| 2023 | 270736 |
| 2022 | 545195 |
| 2021 | 647328 |
| 2020 | 624641 |
| 2019 | 703023 |
| 2018 | 597368 |
| 2017 | 556790 |
| 2016 | 542884 |
| 2015 | 493807 |
| 2014 | 469139 |
| 2013 | 367843 |
| 2012 | 297928 |
| 2011 | 257610 |
| 2010 | 212699 |
| 2009 | 187948 |
| 2008 | 271884 |
| 2007 | 409197 |
| 2006 | 440275 |
| 2005 | 504594 |
| Total | 8400889 |