Key Stats
How many Land Cruiser did Toyota sell in 2023?
Toyota sold 6 Land Cruiser in 2023. In 2022, Toyota sold 48 Land Cruiser. They sold 42 more units in year 2022 compared to 2023 with a percent loss of 87.5% YoY.
Overview
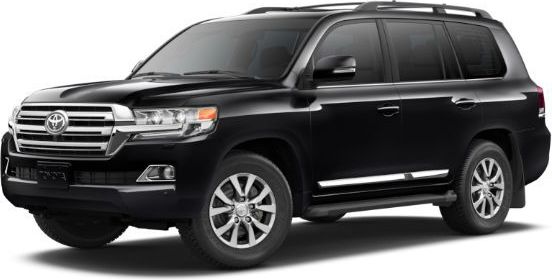
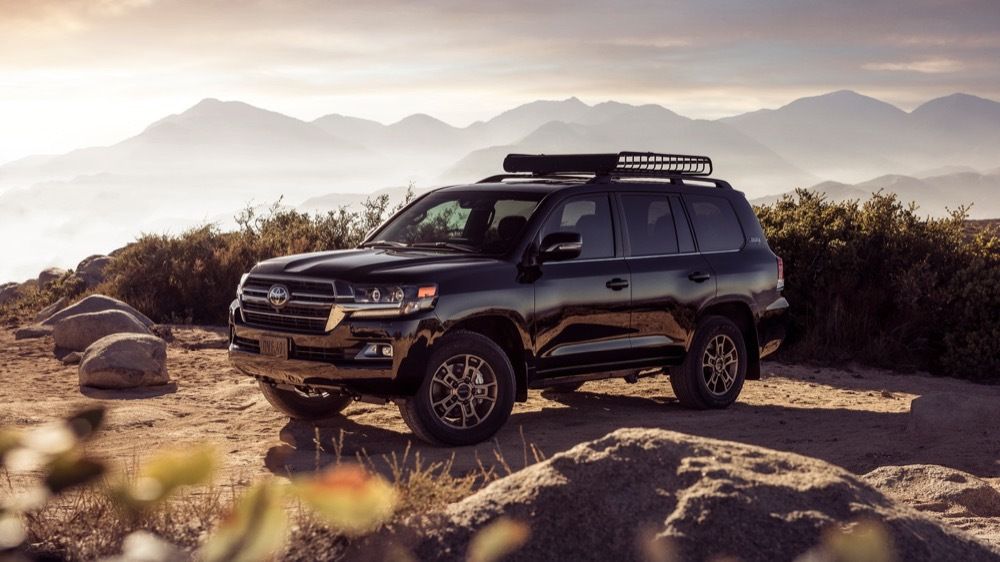
The Toyota Land Cruiser is a SUV with room for 8 people from automaker Toyota.
How Much Does the 2020 Toyota Land Cruiser Cost?
Pricing for the 2020 Toyota Land Cruiser starts at $85,415 MSRP and goes up to $87,745 fully loaded.
Toyota Land Cruiser Engine, Transmission, and Performance Numbers
Toyota Land Cruiser is powered by a 5.7-liter V-8 engine with a 4WD powertrain that makes 381 -hp and torque. The transmission on the Toyota Land Cruiser is an.
2020 Toyota Land Cruiser Fuel Economy
The 2020 Toyota Land Cruiser has a rating of 14 mpg combined.
List of Toyota Land Cruiser Competitors
Some of Toyota Land Cruiser competitors include the Infiniti QX56/QX80 and Land Rover Range Rover.
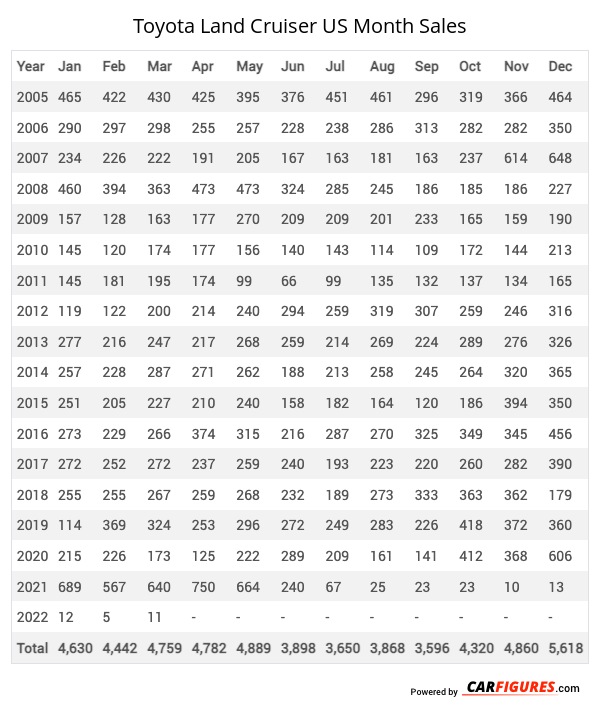
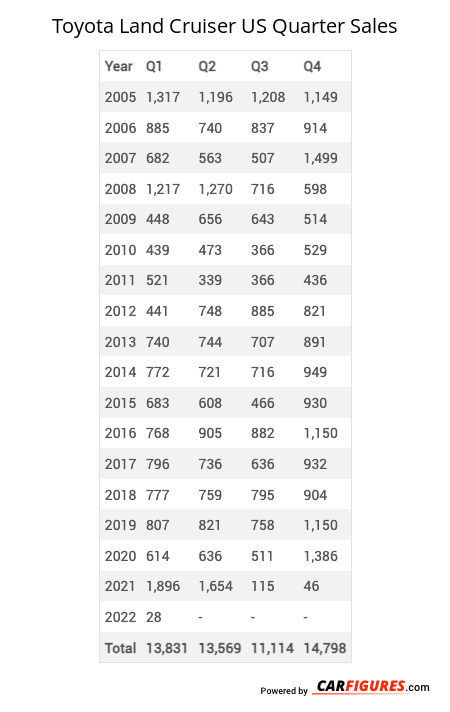
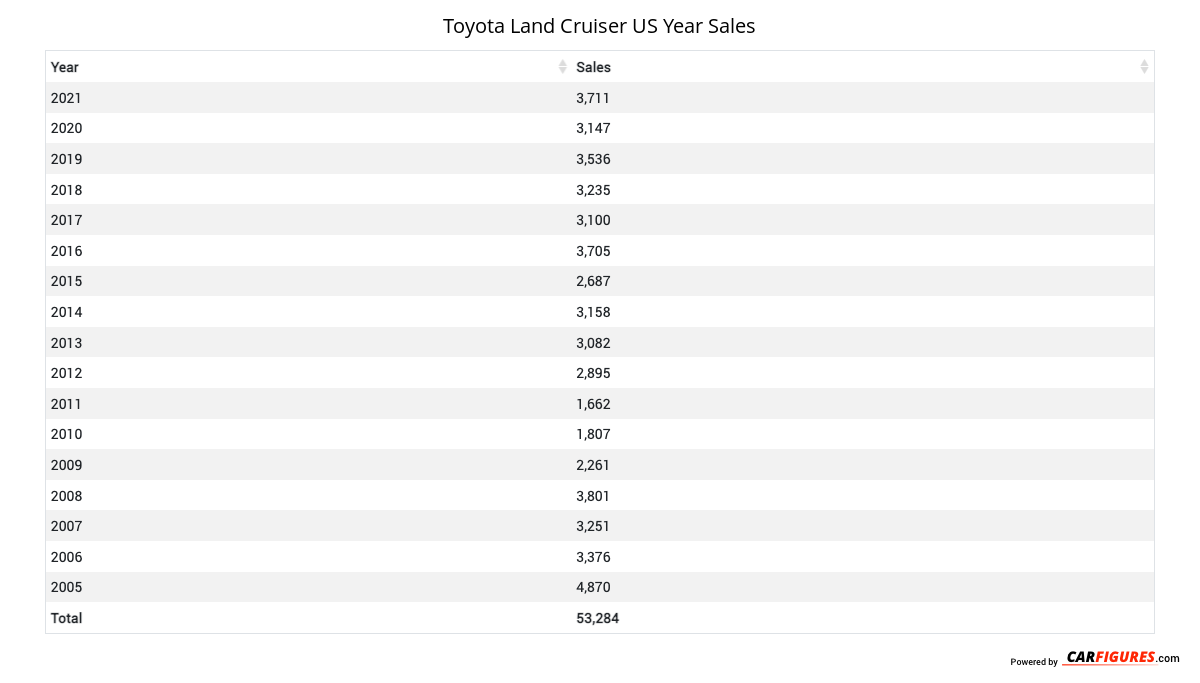
Toyota Land Cruiser United States Sale figures by year, quarter, and month are presented below. Including the most up to date sales data for the Toyota Land Cruiser. See how the Toyota Land Cruiser stacks up the other models in the Crossover/SUVS, Premium Large SUVs segments.
| Year | Jan | Feb | Mar | Apr | May | Jun | Jul | Aug | Sep | Oct | Nov | Dec |
|---|---|---|---|---|---|---|---|---|---|---|---|---|
| 2005 | 465 | 422 | 430 | 425 | 395 | 376 | 451 | 461 | 296 | 319 | 366 | 464 |
| 2006 | 290 | 297 | 298 | 255 | 257 | 228 | 238 | 286 | 313 | 282 | 282 | 350 |
| 2007 | 234 | 226 | 222 | 191 | 205 | 167 | 163 | 181 | 163 | 237 | 614 | 648 |
| 2008 | 460 | 394 | 363 | 473 | 473 | 324 | 285 | 245 | 186 | 185 | 186 | 227 |
| 2009 | 157 | 128 | 163 | 177 | 270 | 209 | 209 | 201 | 233 | 165 | 159 | 190 |
| 2010 | 145 | 120 | 174 | 177 | 156 | 140 | 143 | 114 | 109 | 172 | 144 | 213 |
| 2011 | 145 | 181 | 195 | 174 | 99 | 66 | 99 | 135 | 132 | 137 | 134 | 165 |
| 2012 | 119 | 122 | 200 | 214 | 240 | 294 | 259 | 319 | 307 | 259 | 246 | 316 |
| 2013 | 277 | 216 | 247 | 217 | 268 | 259 | 214 | 269 | 224 | 289 | 276 | 326 |
| 2014 | 257 | 228 | 287 | 271 | 262 | 188 | 213 | 258 | 245 | 264 | 320 | 365 |
| 2015 | 251 | 205 | 227 | 210 | 240 | 158 | 182 | 164 | 120 | 186 | 394 | 350 |
| 2016 | 273 | 229 | 266 | 374 | 315 | 216 | 287 | 270 | 325 | 349 | 345 | 456 |
| 2017 | 272 | 252 | 272 | 237 | 259 | 240 | 193 | 223 | 220 | 260 | 282 | 390 |
| 2018 | 255 | 255 | 267 | 259 | 268 | 232 | 189 | 273 | 333 | 363 | 362 | 179 |
| 2019 | 114 | 369 | 324 | 253 | 296 | 272 | 249 | 283 | 226 | 418 | 372 | 360 |
| 2020 | 215 | 226 | 173 | 125 | 222 | 289 | 209 | 161 | 141 | 412 | 368 | 606 |
| 2021 | 689 | 567 | 640 | 750 | 664 | 240 | 67 | 25 | 23 | 23 | 10 | 13 |
| 2022 | 12 | 5 | 11 | 6 | 5 | 0 | 0 | 4 | 1 | 0 | 1 | 3 |
| 2023 | 1 | 1 | 1 | 1 | 0 | 0 | 0 | 1 | 0 | 0 | 0 | 1 |
| 2024 | - | - | - | - | - | - | - | - | - | - | - | - |
| Total | 4631 | 4443 | 4760 | 4789 | 4894 | 3898 | 3650 | 3873 | 3597 | 4320 | 4861 | 5622 |
| Year | Q1 | Q2 | Q3 | Q4 |
|---|---|---|---|---|
| 2005 | 1317 | 1196 | 1208 | 1149 |
| 2006 | 885 | 740 | 837 | 914 |
| 2007 | 682 | 563 | 507 | 1499 |
| 2008 | 1217 | 1270 | 716 | 598 |
| 2009 | 448 | 656 | 643 | 514 |
| 2010 | 439 | 473 | 366 | 529 |
| 2011 | 521 | 339 | 366 | 436 |
| 2012 | 441 | 748 | 885 | 821 |
| 2013 | 740 | 744 | 707 | 891 |
| 2014 | 772 | 721 | 716 | 949 |
| 2015 | 683 | 608 | 466 | 930 |
| 2016 | 768 | 905 | 882 | 1150 |
| 2017 | 796 | 736 | 636 | 932 |
| 2018 | 777 | 759 | 795 | 904 |
| 2019 | 807 | 821 | 758 | 1150 |
| 2020 | 614 | 636 | 511 | 1386 |
| 2021 | 1896 | 1654 | 115 | 46 |
| 2022 | 28 | 11 | 5 | 4 |
| 2023 | 3 | 1 | 1 | 1 |
| 2024 | - | - | - | - |
| Total | 13834 | 13581 | 11120 | 14803 |
| Year | Sales |
|---|---|
| 2023 | 6 |
| 2022 | 48 |
| 2021 | 3711 |
| 2020 | 3147 |
| 2019 | 3536 |
| 2018 | 3235 |
| 2017 | 3100 |
| 2016 | 3705 |
| 2015 | 2687 |
| 2014 | 3158 |
| 2013 | 3082 |
| 2012 | 2895 |
| 2011 | 1662 |
| 2010 | 1807 |
| 2009 | 2261 |
| 2008 | 3801 |
| 2007 | 3251 |
| 2006 | 3376 |
| 2005 | 4870 |
| Total | 53338 |
Download Historic Sales Data
Embedded Code
See more widgetsSources: Manufacturers