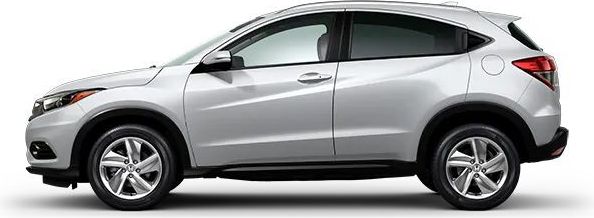
Changan Benben China Chart and Table Sales Widget
Bloggers and website editors, please find below our car sales data widgets. To install a widget, all you have to do is copy and paste the HTML code of the desired widget and insert it on your site.
Embedded Code
Embedded Code
Embedded Code
| Year | Jan | Feb | Mar | Apr | May | Jun | Jul | Aug | Sep | Oct | Nov | Dec |
|---|---|---|---|---|---|---|---|---|---|---|---|---|
| 2009 | - | - | - | - | - | - | - | - | - | - | - | 3436 |
| 2010 | 6393 | 6006 | 6223 | 5268 | 3942 | 4183 | 3008 | 2115 | 3877 | 2409 | 3232 | 3232 |
| 2011 | 6477 | 4764 | 4876 | 2806 | 2154 | 4239 | 928 | 1751 | 1982 | 4446 | 3447 | 1166 |
| 2012 | 5633 | 4707 | 5231 | 5302 | 4397 | 4224 | 3000 | 2119 | 2595 | 1885 | 0 | 2003 |
| 2013 | 4631 | 3993 | 3920 | 1368 | 898 | 668 | 175 | 1038 | 580 | 119 | 67 | 121 |
| 2014 | 0 | 0 | 0 | 0 | 0 | 0 | 0 | 0 | 0 | 0 | 0 | 1 |
| 2015 | 0 | 0 | 0 | 0 | 0 | 0 | 0 | 0 | 0 | 6243 | 5757 | 4248 |
| 2016 | 7134 | 4992 | 3995 | 4986 | 5346 | 3666 | 1343 | 2676 | 3374 | 2846 | 3134 | 3785 |
| 2017 | 7894 | 4709 | 5615 | 3233 | 3026 | 3349 | 3570 | 3972 | 3316 | 3430 | 5700 | 3154 |
| 2018 | 1536 | 1750 | 1535 | 818 | 1542 | 905 | 687 | 44 | 78 | 144 | 70 | 280 |
| 2019 | 764 | 0 | 11 | 24 | 224 | 231 | 195 | 306 | 117 | 112 | 130 | 1179 |
| 2020 | - | 38 | - | 3 | 6 | 5 | 2 | 5 | 2 | - | - | - |
| Total | 40462 | 30959 | 31406 | 23808 | 21535 | 21470 | 12908 | 14026 | 15921 | 21634 | 21537 | 22605 |
Powered by CarFigures.com
Embedded Code
| Year | Q1 | Q2 | Q3 | Q4 |
|---|---|---|---|---|
| 2009 | - | - | - | 3436 |
| 2010 | 18622 | 13393 | 9000 | 8873 |
| 2011 | 16117 | 9199 | 4661 | 9059 |
| 2012 | 15571 | 13923 | 7714 | 3888 |
| 2013 | 12544 | 2934 | 1793 | 307 |
| 2014 | 0 | 0 | 0 | 1 |
| 2015 | 0 | 0 | 0 | 16248 |
| 2016 | 16121 | 13998 | 7393 | 9765 |
| 2017 | 18218 | 9608 | 10858 | 12284 |
| 2018 | 4821 | 3265 | 809 | 494 |
| 2019 | 775 | 479 | 618 | 1421 |
| 2020 | 38 | 14 | 9 | - |
| Total | 102827 | 66813 | 42855 | 65776 |
Powered by CarFigures.com
Embedded Code
| Year | Sales |
|---|---|
| 2020 | 61 |
| 2019 | 3293 |
| 2018 | 9389 |
| 2017 | 50968 |
| 2016 | 47277 |
| 2015 | 16248 |
| 2014 | 1 |
| 2013 | 17578 |
| 2012 | 41096 |
| 2011 | 39036 |
| 2010 | 49888 |
| 2009 | 3436 |
| Total | 278271 |
Powered by CarFigures.com
Embedded Code
Need help with customization or help to embedded widget into your website? Contact Us.


